
Prof Kaushik Akiwatkar@kaushikaki
Sep 9, 2022
18 tweets
Thread-2 | Basic Patterns of P&F Charts
In this thread we will discuss:
1. Column Reversal
2. Double Top Buy (DTB)
3. Double Bottom Sell (DBS)
1/16
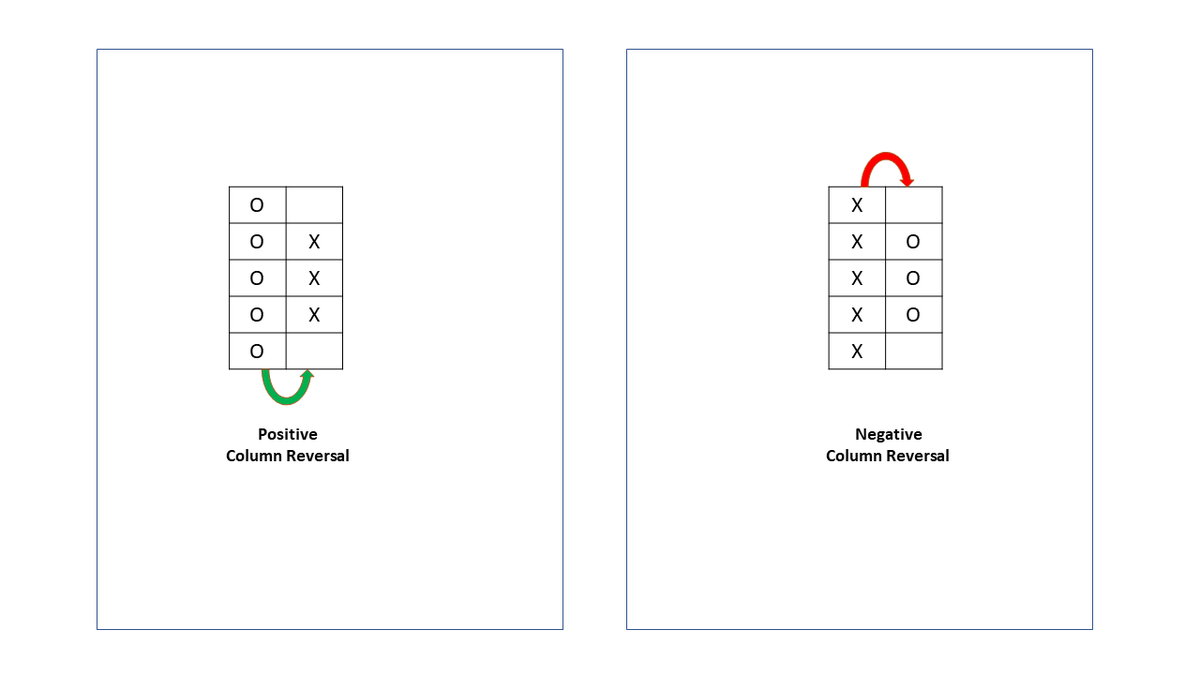
Column Reversal
In the first thread of the Twitter Thread series, we discussed the construction of P&F charts. So, for a quick recap, a shift in column happens in the P&F chart only when reversal criteria is met.
2/16
In 3-box reversal charts, the price needs to reverse by three times the box size to change the column from ‘X’ to ‘O” and vice versa. This feature of chart construction removes noise formed due to data movement and only significant moves are plotted.
3/16
This switchover from the column of ‘X’ to ‘O’ or vice versa is known as Column Reversal. There are two types of column reversal – Positive and Negative.
Let me explain to you that we attached the image
4/16
It is a pattern that is formed at every column and hence becomes the base pattern for P&F Charts.
We discussed earlier that any column in the 3-box reversal chart will have a minimum of 3 boxes and will be printed once reversal criteria is met.
5/16
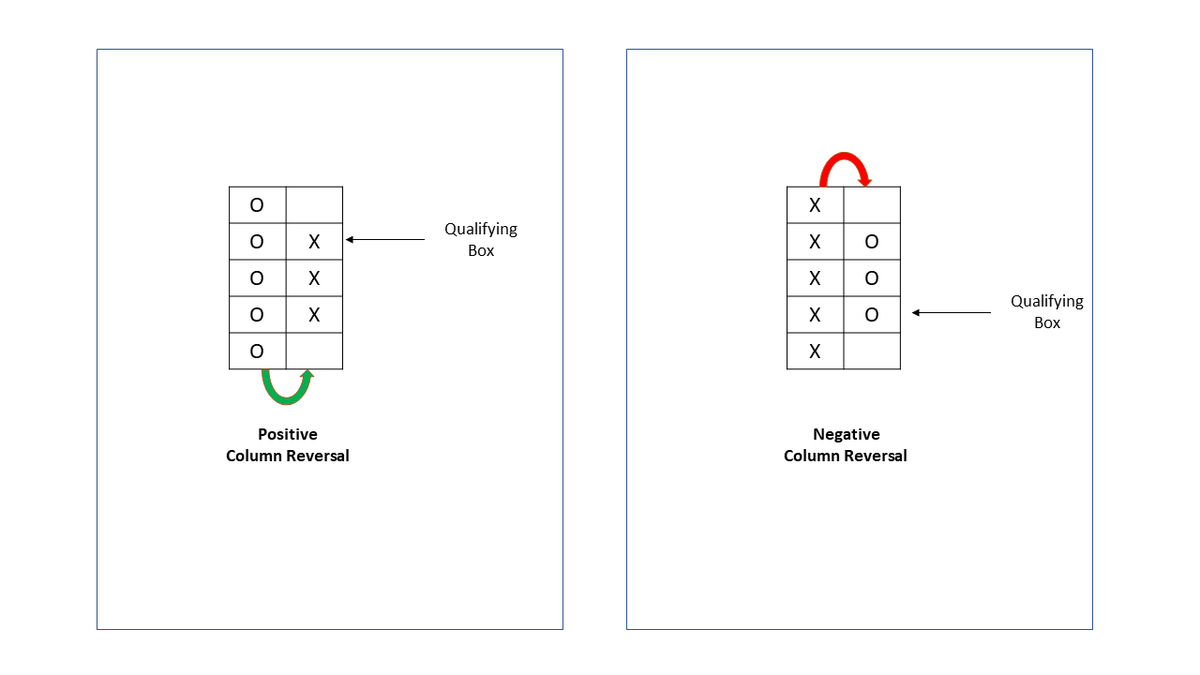
P&F Charts are basically swing charts. Every time a column is turned to ‘O’, it forms a swing high, which is the high box-price of column of ‘X from which it is turning.
Similarly swing low is marked when the column turns to ‘X’
6/16
This basic pattern is very useful when designing various price setups and also a very important formation when analysing higher box-values.
7/16
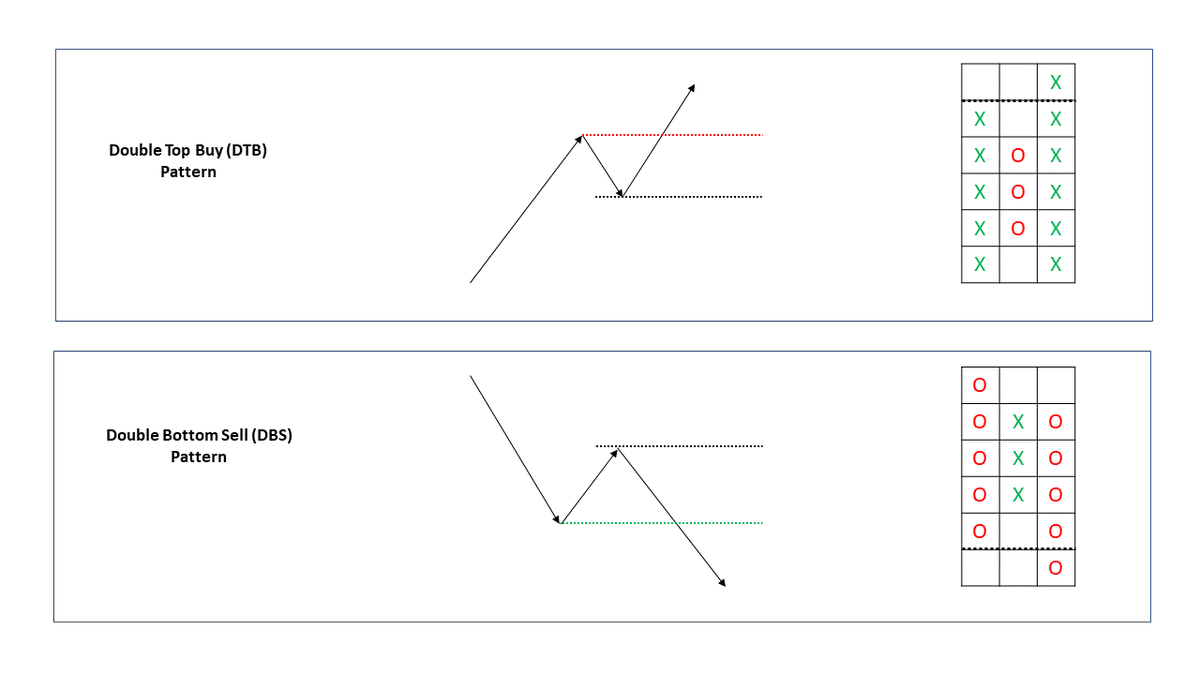
Let us now understand the basic buy and sell signal of P&F Charts. The are known as Double Top Buy (DTB) and Double Bottom Sell (DBS)
DTB is Bullish pattern
DBS is Bearish pattern
8/16
Double Top is a bearish formation and Double Bottom is a bullish formation in traditional technical analysis.
In P&F Chart is exactly the opposite. DTB is resistance breakout and DBS is support breakdown
9/16
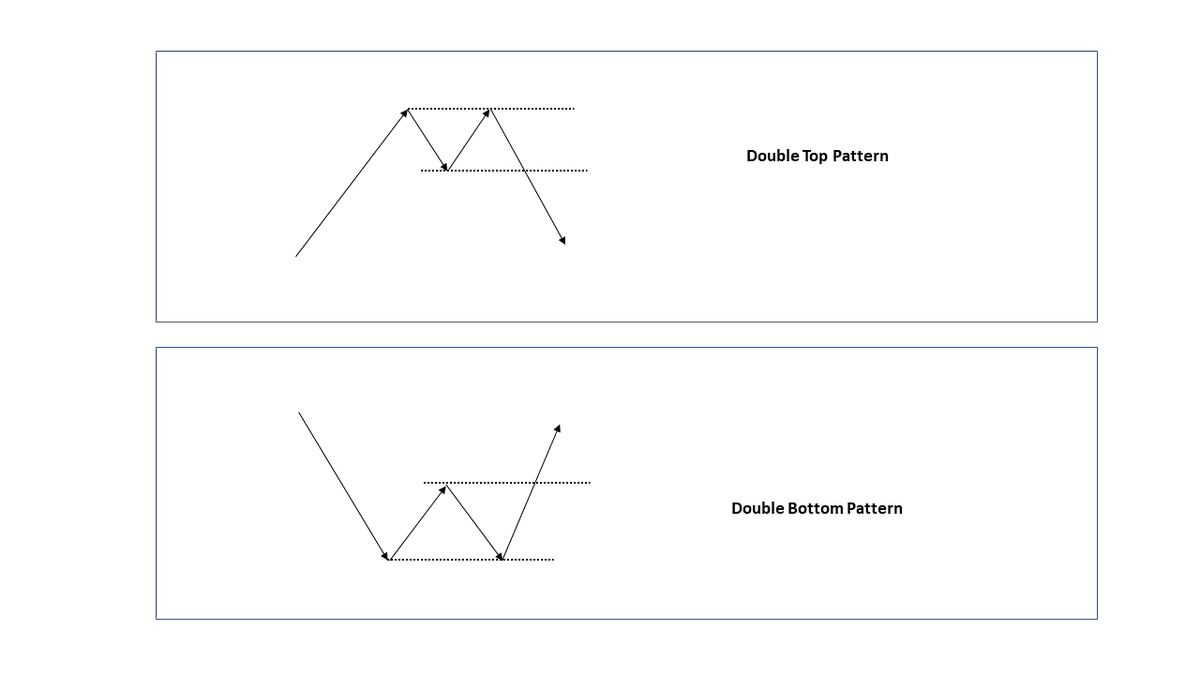
P&F Double Top is a buy signal that indicates that the price has tested previous resistance and broken out. Similarly, P&F Double Bottom is a sell signal that indicates price tested the support and brokedown
DTB and DBS are a 3-column pattern.
10/16
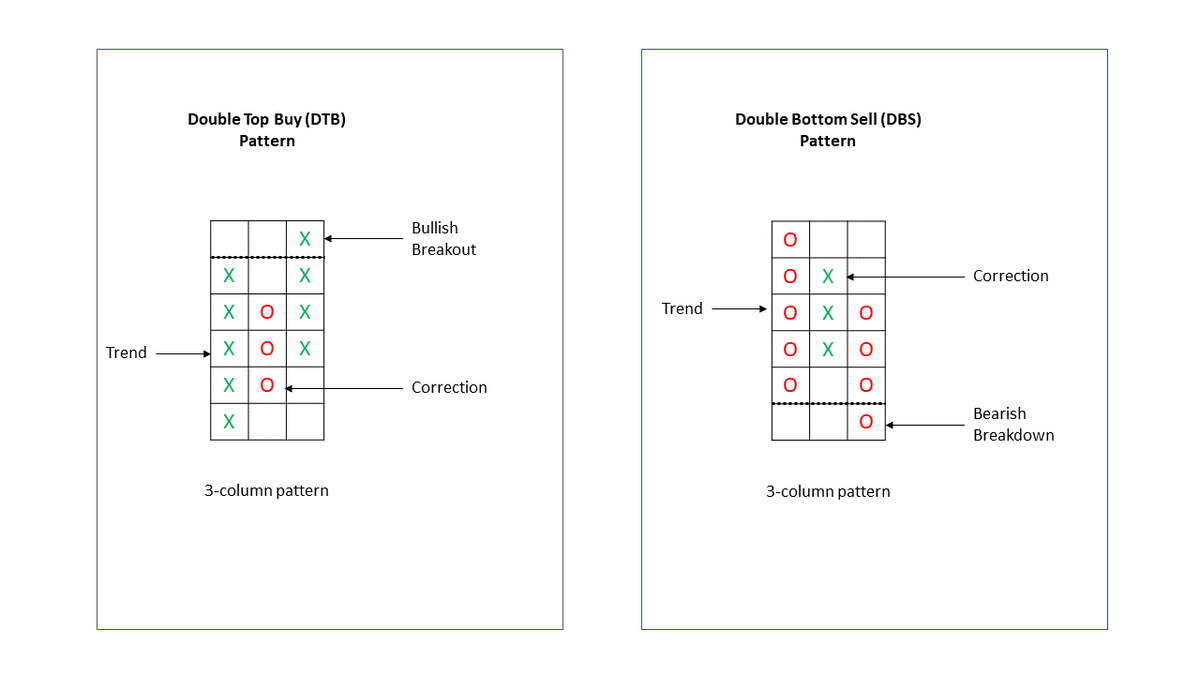
DTB is formed when the price moves one box high of the immediate previous column of ‘X’ and similarly, DBS is formed when the price moves one box lower to the immediate previous column of ‘O’
11/16
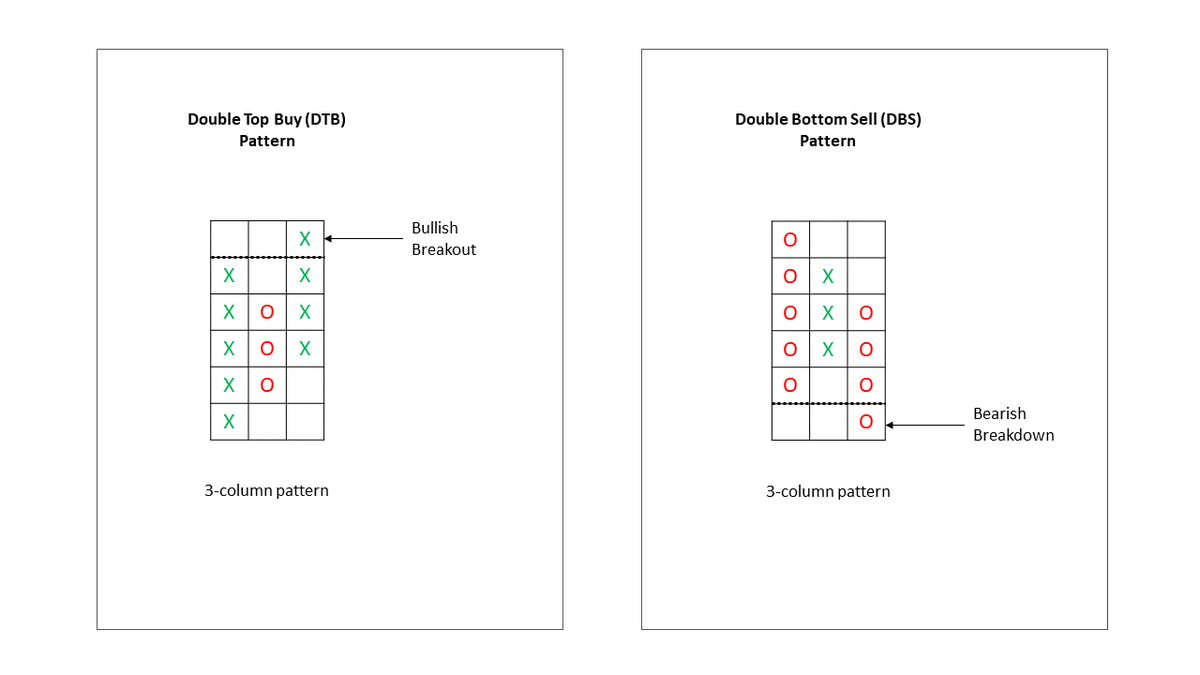
DTB and DBS signals are the basic formations of P&F charts. They display swing breakouts. The 3-column represents Trend-Correction-Breakout.
As explained in the image below.
12/16
DTB and DBS are the basic P&F patterns and all other patterns are built over this as they represent swing breakout and breakdown. But having said that P&F provides objective patterns with a clear signals of Buy and Sell.
13/16
Are DTB and DBS pattern enough to take trading decisions? Answer is NO. Context is required to take the decision.
Context like Which Box Size you are using? What is the preceding trend of the asset? We will discuss this as we move forward in the weekly P&F learning series.
14/16
With this, we have come to the end of the thread. In the next thread, I will be discussing 'Box Size and its importance'.
We will also deep dive into how to analyse charts on different box sizes and which patterns we should look at when analysing P&F Charts.
15/16
If you loved this thread and my sincere effort to help in your learning curve, please help me reach a larger audience by re-tweeting the first tweet.
Till then stay connected
Telegram: t.me/thenoiselesstr
YouTube: youtube.com/c/TheNoiseless
16/16

To the Top  RT the tweet below to share this thread with your network. Your Retweet will help learners like you in your network.
RT the tweet below to share this thread with your network. Your Retweet will help learners like you in your network.Prof Kaushik Akiwatkar@kaushikaki
Sep 09 22
View on Twitter
Thread-2 | Basic Patterns of P&F Charts
In this thread we will discuss:
1. Column Reversal
2. Double Top Buy (DTB)
3. Double Bottom Sell (DBS)
1/16
Continue learning?
Read thread-3 on Box Size on P&F Charts
twitter.com/kaushikaki/sta
Prof Kaushik Akiwatkar@kaushikaki
Sep 13 22
View on Twitter
Thread-3
Box Size for P&F Charts
In this thread we will discuss:
1. Box Value into different slots
2. Pattern formation in each slot
3. Importance of patterns in different box values
1/18

Prof Kaushik Akiwatkar
@kaushikaki
Head of Product at @elearnmarkets | Former Dean & Professor | Derivative Trader and Mentor
Telegram - https://t.co/dONo8UCrUt
Missing some tweets in this thread? Or failed to load images or videos? You can try to .