
Intrinsic Compounding@soicfinance
Sep 23, 2022
26 tweets
Everything about P/E Ratios Simplified!
In this thread we will learn:-
 What is the Meaning of PE ratios?
 Why PE ratios are important?
 5 Unique ways to Look at the PE of companies
Retweet to educate maximum Investors
5 Unique ways to Look at the PE of companies
Retweet to educate maximum Investors
What is the Meaning of PE ratios?
Why PE ratios are important?
5 Unique ways to Look at the PE of companies
Retweet to educate maximum Investors 
Price to Earnings ratio simply Means how much price are you paying for Rs. 1 of earning of the asset.
For example:-
If you invest Rs 100 in a Fixed Deposit at 6% (Rs 6 of interest)
PE= 100(Price)/6(earning)=16.6 times
To Earn Rs 1 from FD, you are paying Rs 16.6
Similarly, You can Calculate Price to Earnings Ratio's of Businesses.
Two Ways you can calculate this:
Market Cap of the company/Profit After Tax of the company
or
Share Price of the company/Earnings Per share of the company
For Example:-
Market Cap of Larsen & Toubro Infotech right now= 77,349 crores
Earnings or PAT= Rs. 2436 Crores (Last 4 Quarters= Trailing twelve months=TTM)
PE= 77,349/2436= 31.7 Times PE ratio on a TTM basis
Similarly, Share Price of Larsen & Toubro Infotech= Rs 4413
Earnings Per Share= Rs 139
PE= 31.7 Times
Thus, you can calculate PE Ratio's for companies using these two methods!
Now, you might wonder what is the significance of PE Ratio's:
. PE Ratio is one of the most widely used valuation metrics for Indices, sectors and Companies.
. PE is a quick way to compare whether the investment that you are making is cheap or expensive in an asset class.
. PE Ratio is one of the most widely used valuation metrics for Indices, sectors and Companies.
. PE is a quick way to compare whether the investment that you are making is cheap or expensive in an asset class.. Historical PE ratios for Sectors and Companies can help you to identify what the Market in its wisdom has valued the sector or the company like over the years.
Thus, I personally like to call PE ratio as=
Perception/Earnings Ratio for a company (Write this down somewhere)Let's look at Five Vantage Points in How PE can fool an investor and adjustments that should be made to get to a more accurate picture!
View Point :-
Trailing Twelve Month Multiple vs Forward Multiples with the Example of Deepak Nitrite in 2018 when its huge plant for Phenol was commissioned.
:-
Trailing Twelve Month Multiple vs Forward Multiples with the Example of Deepak Nitrite in 2018 when its huge plant for Phenol was commissioned.A TTM PE simple means: What is the PE ratio on the basis of last 4 Quarters of Earnings for the Company.
Last 4 Quarters include the currently concluded quarter and Proceeding the Quarters. As indicated here:-
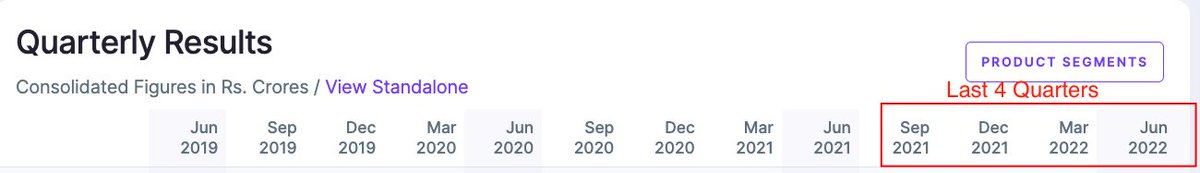
In 2018 when Deepak Nitrite's Capex for Phenol was commissioned. It's Trailing Twelve Month Earnings were at 81x!
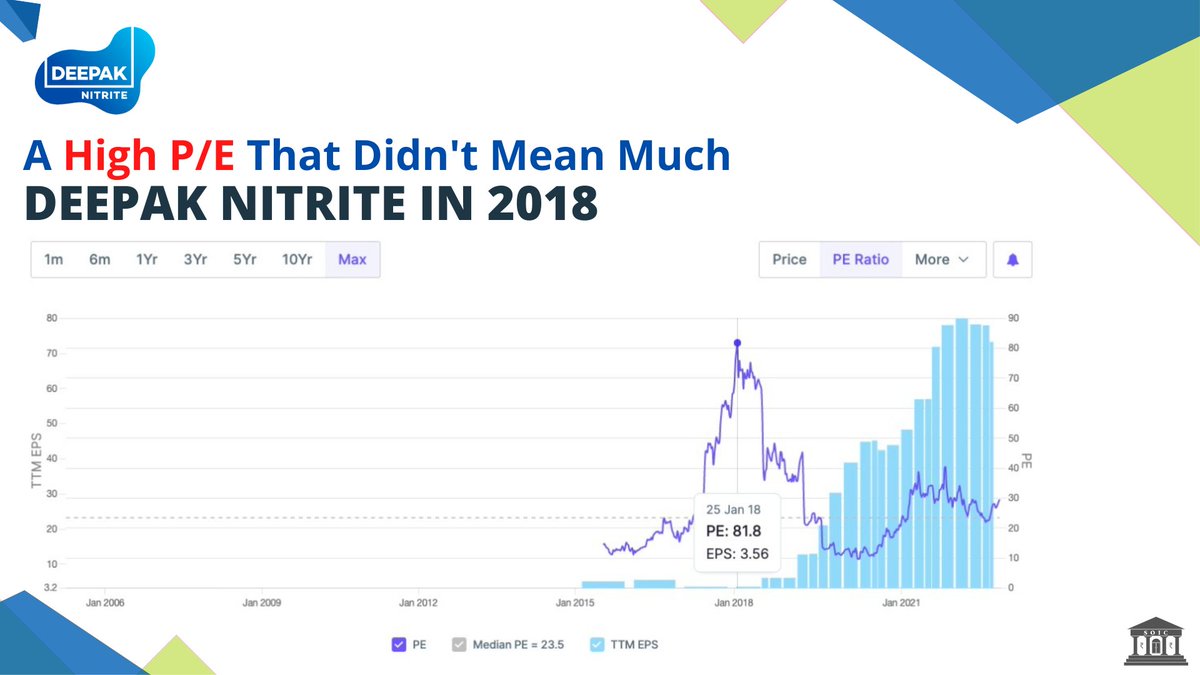
However, as the PAT started growing the elevated PE soon fell from 81x to 11x within 12 months.
A Forward PE means= The forward P/E ratio divides the current share price of a company by the estimated future (“forward”) earnings per share (EPS) of that company.
In Companies where you expect fast PAT growth, A Forward PE might serve better vs Trailing Multiples.
Here DNL is just an example, I know there might be hindsight bias. Why not learn the concept first ;)?
Vantage Point :-
When Earnings Back Fill into Price/Perception of a Company. High PE might become reasonable if Earnings grow Rapidly
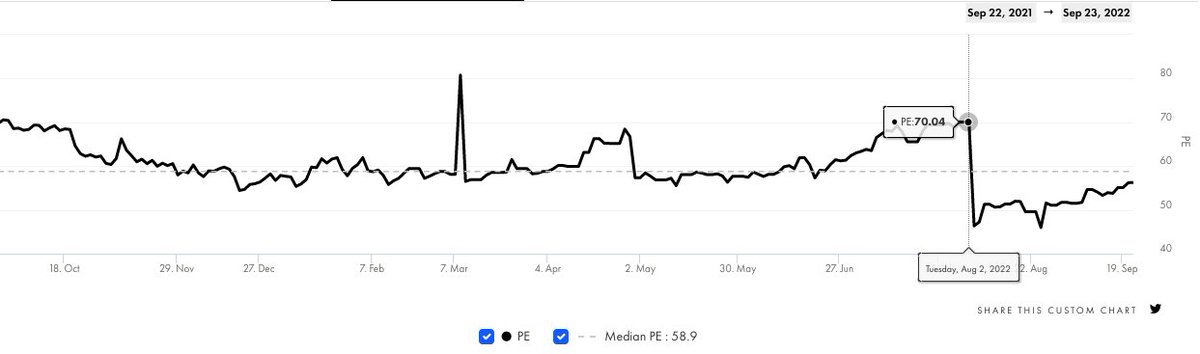
Here lets take the example of a company that was trading at a PE ratio of 73x Pre-results.
:-
When Earnings Back Fill into Price/Perception of a Company. High PE might become reasonable if Earnings grow Rapidly
Here lets take the example of a company that was trading at a PE ratio of 73x Pre-results.Once the results were announced, PE fell from 73x to 45x. Simply because Earnings grew more than 100%+ Year on Year.
In Such cases, even though the stock had run up pre results. Post results again the stock was available at less than its median PE (Less than average)
Why did this happen?
Simply because=
PE= Price/Earnings. If Earnings grow exponentially and price is flat. Then PE falls.
This is what we call= When Earnings Back fill into Price.
Stock is another 45% up post since then, had one focused.
@Tijori
Vantage Point :-
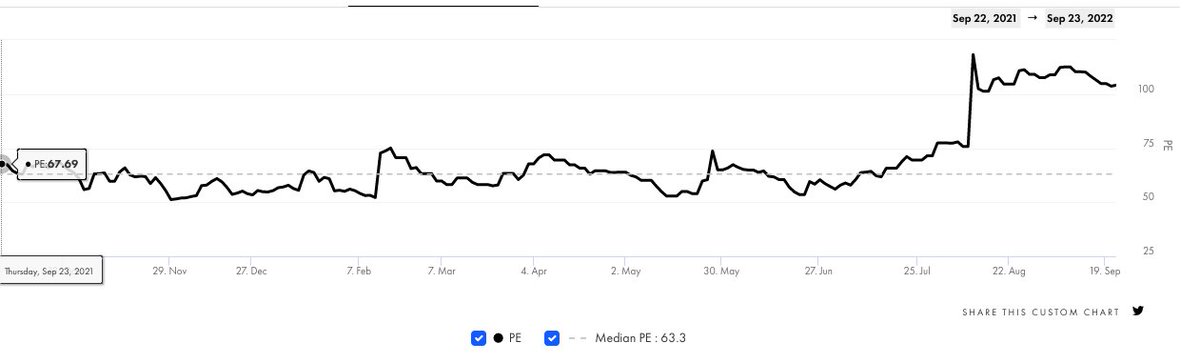
When Earnings fall. High PE might become even higher as Quantum of Earnings fall is huge.
In Such cases, even if the Stock Falls by 70%+, the PE might still expand further and The Earnings have taken a huge hit for the company.
Check the Stock Price:-
:-
When Earnings fall. High PE might become even higher as Quantum of Earnings fall is huge.
In Such cases, even if the Stock Falls by 70%+, the PE might still expand further and The Earnings have taken a huge hit for the company.
Check the Stock Price:- 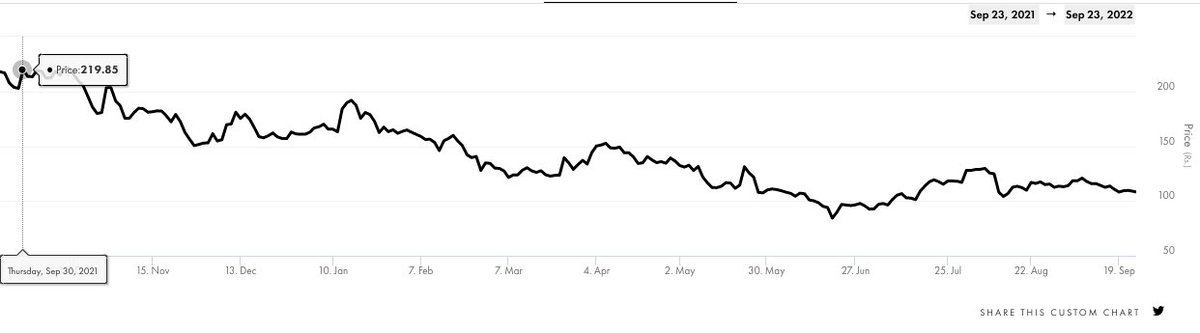
Yet the PE ratio has further increased from 66 times to 103 times earnings as the Earnings have seen a massive erosion!
Vantage Point  :
In Cyclical often High PE means the Earnings have bottomed out or are close to bottoming out.
A Low PE might mean that the Peak Earnings might be close.
Check the PE ratio of this Tyre company once!
100x :)
:
In Cyclical often High PE means the Earnings have bottomed out or are close to bottoming out.
A Low PE might mean that the Peak Earnings might be close.
Check the PE ratio of this Tyre company once!
100x :)
:
In Cyclical often High PE means the Earnings have bottomed out or are close to bottoming out.
A Low PE might mean that the Peak Earnings might be close.
Check the PE ratio of this Tyre company once!
100x :) 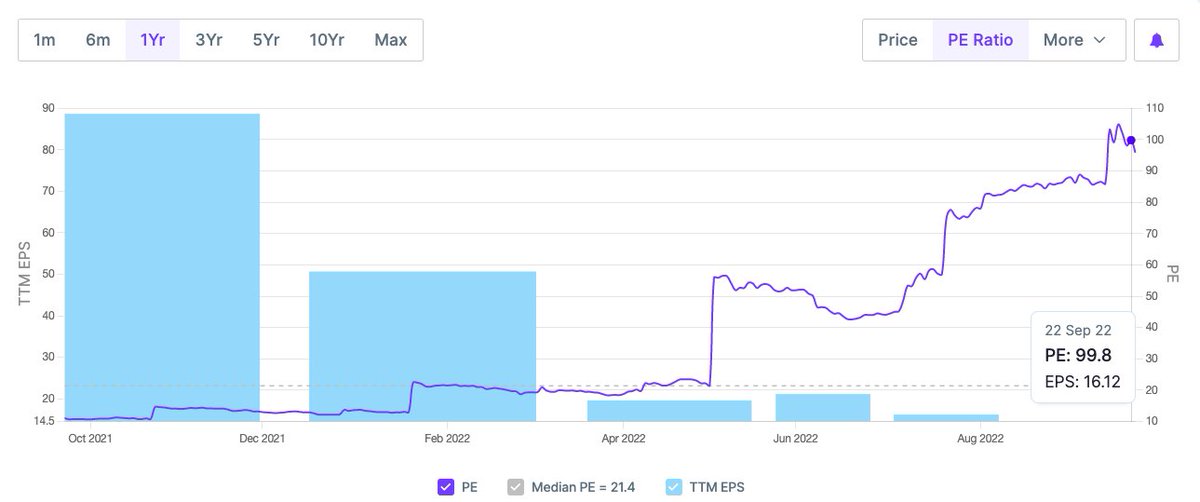
Why is it 100x?
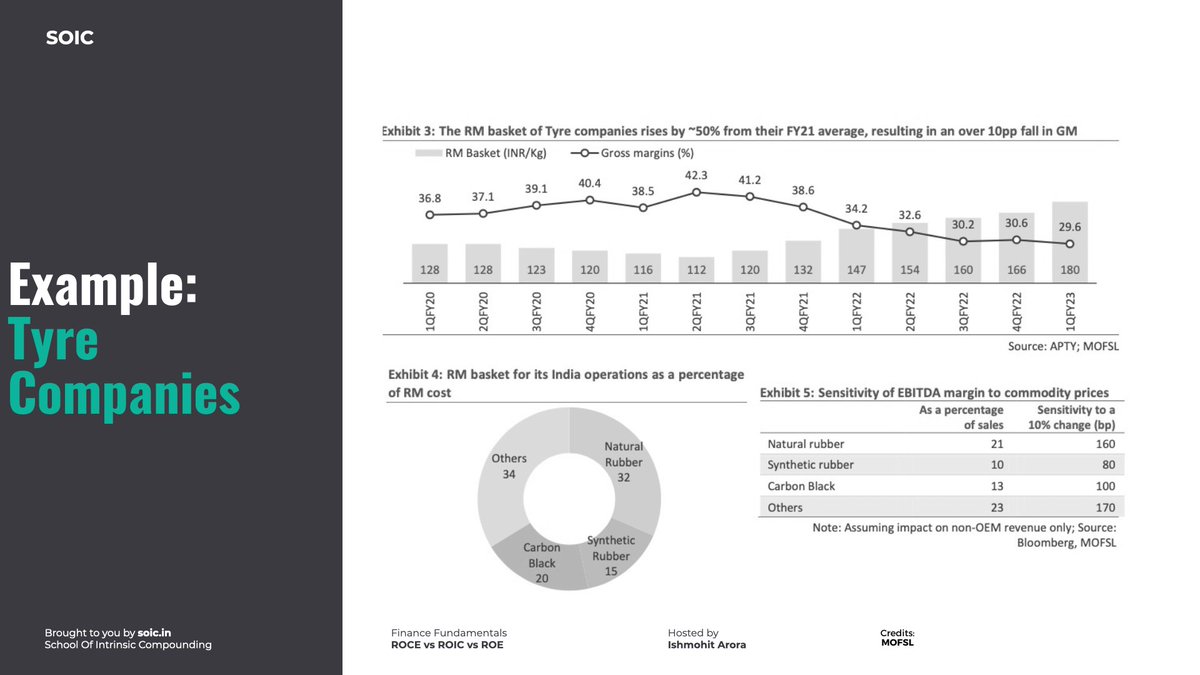
Simply because, the Tyre companies basic Raw Materials are Crude oil derivatives, Rubber & Carbon Black, whose pricing had risen leading to Margin erosion for these companies:-
In Cyclicals, PE Ratio can end up fooling you at the bottom of the cycle.
If margins normalise or RM prices fall then the Earnings will come back equally ferociously.
In Cyclical investing, understand what is causing pain or pleasure for Earnings is extremely important!!
Vantage Point  : Always Adjust PE ratios for one off Earnings of a Business!
Eg:- Aarti Industries currently has a PE ratio of 23 Times. This might fool a new investor, thinking its cheap.
This is where you need to normalise and view the PE of companies.
: Always Adjust PE ratios for one off Earnings of a Business!
Eg:- Aarti Industries currently has a PE ratio of 23 Times. This might fool a new investor, thinking its cheap.
This is where you need to normalise and view the PE of companies.
: Always Adjust PE ratios for one off Earnings of a Business!
Eg:- Aarti Industries currently has a PE ratio of 23 Times. This might fool a new investor, thinking its cheap.
This is where you need to normalise and view the PE of companies.Just check Q3FY22 for AARTI Industries. The PAT looks abnormally high.
Have you wondered why?
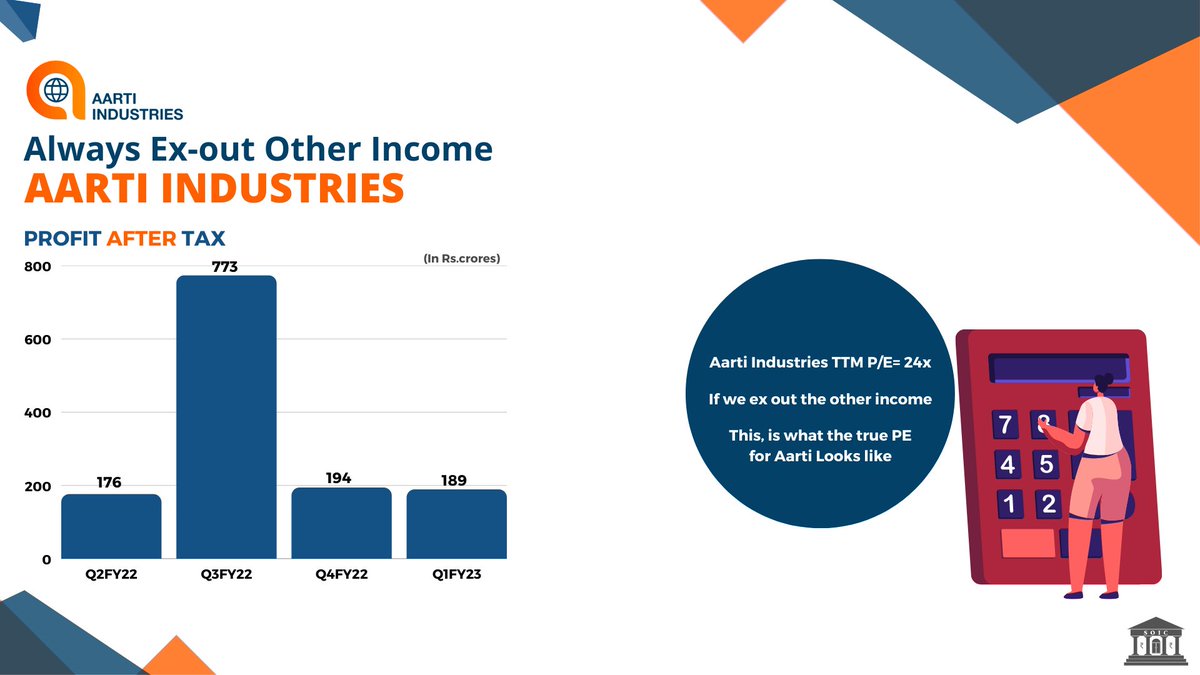
Now Let’s calculate the PE of Aarti Industries adjusted for this income as it is one time in nature:-
TTM PAT=
1331 Crores-631 Crores=700 crores PAT
PE= 30,944 cr(mcap)/700
= 44.2x is the PE adjusted for the One off Earnings!
This was the thread on PE ratios. We will do a much more elaborate one on Sector Pe ratios, index PE ratios and Returns ratios+PE's soon!
I teach Fundamental analysis & Business analysis at
soic.in/soicmembership/
(P.s. there is a 12 day free course too on the website)
Link to our Youtube Channel:- youtube.com/channel/UCB7Gn…
Thank you for reading :)

Intrinsic Compounding
@soicfinance
🏛Seeking wisdom in the Indian Stock Markets. We are not SEBI Registered Advisors/Analyst, nothing should be considered as investment advice.
Missing some tweets in this thread? Or failed to load images or videos? You can try to .