


 Dave Burton@ncdave4life
Dave BurtonApr 11, 2024
7 tweets
1/7》GCP emission data shows 185.58 ppmv of fossil carbon emissions from 1959-2021 (plus a poorly constrained amt of non-fossil "land use change emissions"). Only about 5.56 ppmv (3%) was CO2 released from limestone [CaCO3] as it's baked to make cement.
twitter.com/ncdave4life/st
Dave Burton@ncdave4life
Dave BurtonFeb 03 24
View on Twitter
Mankind adds about 5 ppmv of fossil CO2 to the air each year. The net sum of all natural fluxes remove about 2.5 ppmv of CO2 in an average year.
sealevel.info/carbon/carbonf
Precise CO2 level measurements began in 1958. If you run the numbers you'll find that ≥164% of the CO2 increase since 1958 was due to human CO2 emissions.
That's not a typo. The amount of CO2 in the air increased much less than the amount we've added, because Nature (the sum of all natural CO2 fluxes) is removing CO2 from the atmosphere.
Now I'll show you the numbers, and the math. Buckle up!
sealevel.info/carbon/
First, consider the anthropogenic emissions:
Here's a spreadsheet of data from the Global Carbon Project (except that I've converted their MtCO2 figures to MtC):
sealevel.info/carbon/global.
sealevel.info/carbon/global.
Here's the same spreadsheet, to which I've added a couple of rows with summed emission data for 1959-2021 (rows 290 and 291):
sealevel.info/global.1751_20
Aside (conversion factors):
1 PgC = 3.66419 Gt CO2.
1 ppmv CO2 ≅ 7.8024 Gt CO2 = 2.1294 PgC.
The GCP's emission data shows 185.58 ppmv of fossil carbon emissions.
(Aside: only 5.56 ppmv of that is listed as CO2 from cement manufacturing. That's the CO2 released from limestone [CaCO3] as it's baked in the kiln. It is commonly claimed that cement manufacturing is responsible for up to 8% of all anthropogenic CO2 emissions, but that figure includes an estimate of emissions from the fossil fuels which are burned to heat the kilns, typically accounting about half of the total CO2 emissions from cement manufacturing, though that varies according to how the kiln is fired.)
In addition to fossil CO2 (from burning fossil fuels and making cement), the GCP estimates that 24.67 to 53.20 ppmv of CO2 has been released since 1958 due to "Land Use Changes" (average of 3 studies = 39.98 ppmv). Obviously, those figures are poorly constrained.
185.58 + 24.67 = 210.25 ppmv (their smallest estimate which includes averaged land use emission estimates).
185.58 + 39.98 = 225.56 ppmv (their total including averaged land use emission estimates from 3 studies).
185.58 + 53.20 = 238.78 ppmv (their largest estimate which includes averaged land use emission estimates).
If we add a generous ±10% uncertainty to those figures, we can say with very high confidence that during the years 1959 through 2021 (inclusive) mankind added 167 to 263 ppmv of CO2 to the atmosphere.
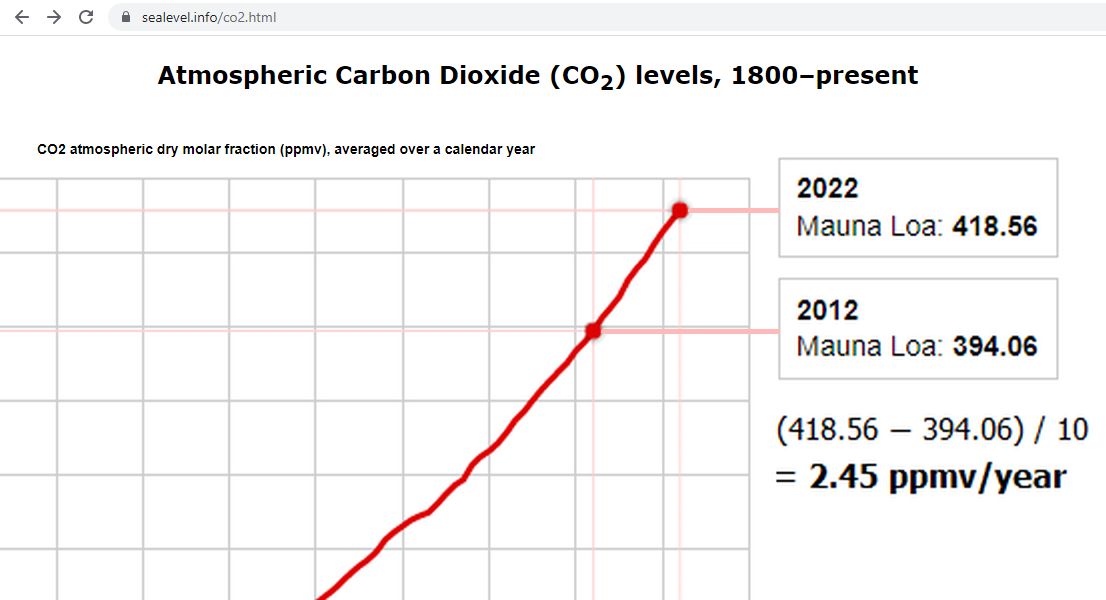
Now, consider the atmospheric CO2 measurements. These are from Mauna Loa:
sealevel.info/co2.html
(Hover your mouse over the CO2 trace to see the data for any date.)
They show:
1958 CO2 level (extrapolated from a partial year of measurements): 315.34 ppmv
1959 CO2 level: 315.98 ppmv
Estimated seasonally adjusted CO2 level at start of 1959 = (315.34+315.98)/2 = 315.66 ppmv
2021 CO2 level: 416.45 ppmv
2022 CO2 level: 418.56 ppmv
Estimated seasonally adjusted CO2 level at start of 2022 = (416.45+418.56)/2 = 417.505 ppmv
Total increase in CO2 level from start of 1959 to start of 2022 = (417.505 - 315.66) = 101.845 ppmv
Now we'll do the arithmetic:
Thus we now know that, since 1958 (through 2021):
● mankind has added 167 to 263 ppmv of CO2 to the atmosphere (probably between 185 and 239 ppmv).
● the amount of CO2 in the atmosphere increased by only 102 ppmv.
● So, nature has removed a net total of ((185 to 239) - 102) = 83 to 137 ppmv CO2 from the atmosphere.
(167/102) ≅ 164%
(263/102) ≅ 258%
So:
● 164% to 258% of the increase in atmospheric CO2 concentration since 1958 was anthropogenic.
That's proof that more than the entire increase in atmospheric CO2 concentration since 1958 is man-made.
Note that to deduce that fact we don't need any models (Bern, or any other). We don't need isotope data. We don't need to know residence times, turnover times, or adjustment times. We don't need to estimate flows between individual carbon reservoirs. We don't need to know anything at all about the many individual natural CO2 fluxes. And, since we're using whole-year averages, we don't need to know anything about vegetation-driven and temperature-driven seasonal patterns or how they differ with latitude.
Many of those things are interesting, and some of them are important for other reasons, but they are irrelevant to the proof of the fact that all of the increase in atmospheric CO2 concentration since 1958 is due to human emissions.
2/7》It's estimated that, on average, as concrete weathers it absorbs roughly half as much CO2 as was released from the limestone when it was made. That halves the 3% (5.56 ppmv) figure to 1.5%. The process is akin to natural rock weathering:
sealevel.info/feedbacks.html

3/7》It's often claimed that cement manufacturing causes "up to 8%" of anthropogenic CO2 emissions, but that figure includes estimated emissions from the fossil fuels burned to heat the kilns, typically accounting about half the total (though it varies according to how the kilns are fired).
cfdflowengineering.com/cfd-modeling-o

4/7》Note, though, that as mankind added that 185.58 ppmv of CO2 to the air (plus "land use change emissions"), the amount of CO2 in the air increased by only (416.41-315.24)= about 101 ppmv.
sealevel.info/co2.html
That's because "Nature" (the net sum of natural fluxes) simultaneously removed about 84 ppmv.
In fact, nature is currently removing an average net sum of about 2.5 ppmv of CO2 from the air each year (plus whatever you estimate our "land use change emissions" to be).
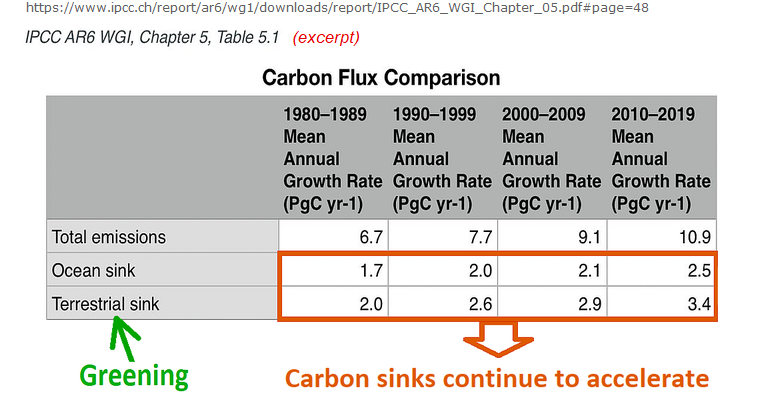
5/7》The higher CO2 levels in the atmosphere rise, the faster Nature removes CO2 from the air. For each 40-50 ppmv increase in the CO2 level, natural CO2 removals accelerate by about 1 ppmv/year.
sealevel.info/AR6_WG1_Table_
This is one of the most important (albeit underappreciated) climate feedback mechanisms. It's really the combined effect of several feedbacks:
1. CO2 Fertilization Feedback (“greening”).
2. CO2 Absorption By Water Feedback.
3. CO2 Coccolithophore Feedback.
4. Rock Weathering Feedback.
sealevel.info/feedbacks.html


Piyush Tank@Piyush__Tank
Apr 09 24
View on Twitter
sounds too good to be true! are there some sources, ideally peer-reviewed on this. I am just cautious before I feel excited :)
6/7》The atmospheric CO2 level is currently rising ≈2.45 ppmv/year.
sealevel.info/co2_2012-2022_
That means if CO2 emissions were to continue at their current rate indefinitely, the atmospheric CO2 concentration would plateau at only 422 + (2.45 × (45±5)) ≅ 530 ppmv (which is 26% of a doubling).
(That's added to the 50% of doubling [280→420 ppmv] seen since the preindustrial late Little Ice Age, which has, so far, given us an estimated approximately 1°C of warming.)
7/7》If any of this surprises you, you might not be getting balanced, accurate info. I'm here to help:
sealevel.info/learnmore.html
That resource list has:
● accurate introductory climatology info
● in-depth science from BOTH skeptics & alarmists
● links to balanced debates between experts on BOTH sides
● info about climate impacts
● links to the best blogs on BOTH sides of the climate debate

Dave Burton
Dave Burton@ncdave4life
My preferred pronoun is "harmless data drudge." https://t.co/YTkK6vaHGs Tel: +1 919-481-0098.
Missing some tweets in this thread? Or failed to load images or videos? You can try to .