


 Dave Burton@ncdave4life
Dave BurtonJun 10, 2024
11 tweets
1/11. When someone talks about a sea-level measurement record starting in 1993 it means they're using low quality satellite altimetry data, and they're ignoring the much higher quality coastal measurements. It's political propaganda, not unbiased science.
sealevel.info/satellite_alti

2/11. If you use the (much higher quality) coastal measurement data, it becomes clear that there's nothing to worry about.
sealevel.info/learnmore.html
That's Honolulu, which has the best quality, well-sited, sea-level measurement record in the world. The "straightness" of the blue sea-level trend means that rising CO2 levels haven't had much effect on sea-level.
3/11. The "straightness" is called "linearity," and it's opposite is called "acceleration." If you don't know how to recognize "acceleration," "deceleration," or "linearity" in a graph, here's a little primer which should help:
sealevel.info/acceleration_p

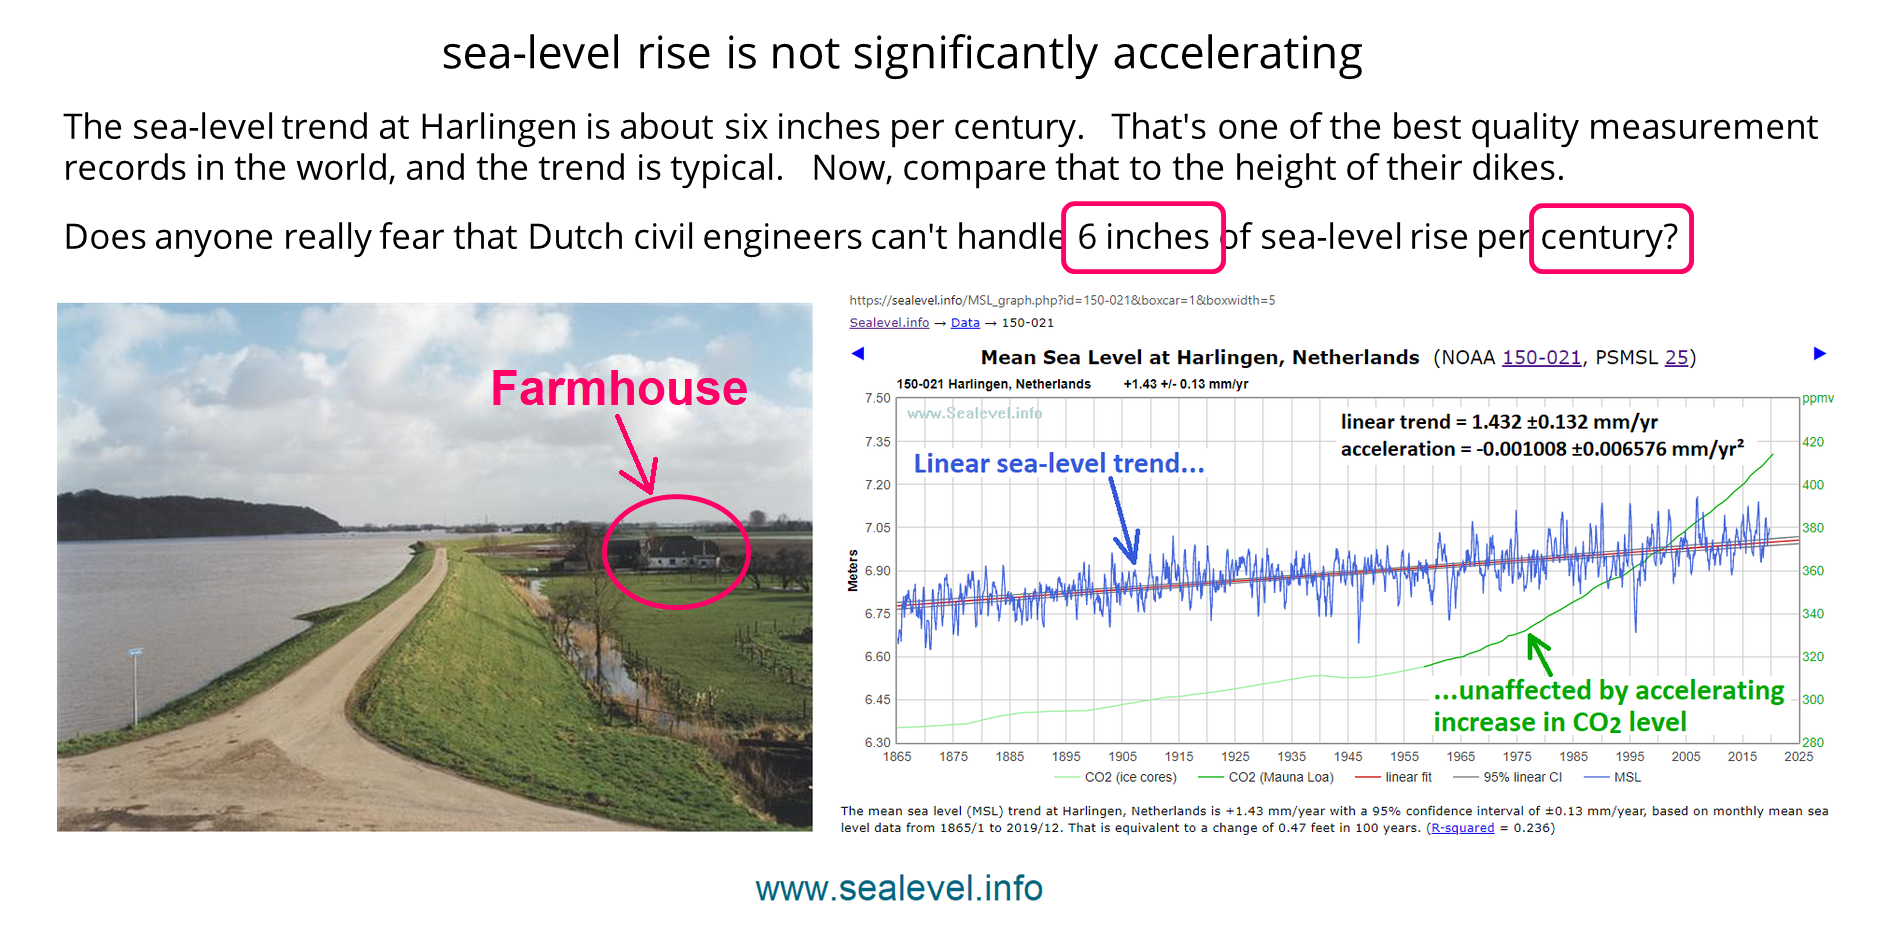
4/11. Honolulu is the best quality, well-sited, sea-level measurement record in the world, but it's not the longest. Here's a Dutch measurement record with 158 years of continuous data!
sealevel.info/MSL_graph.php?
The linear trend is 1.47 ±0.13 mm/yr
The acceleration is 0.00 ±0.01 mm/yr²
sealevel.info/Dutch_dike_vs_

5/11. Some high quality coastal measurement records show a miniscule acceleration, and others show none at all. Hogarth (2014) reported that, "acceleration from extended tide gauge data converges on 0.01 mm/yr²."
That's negligible. That much acceleration, were it to persist for 150 years, would add a total of just 4.4 inches to average coastal sea-level. (That would be in addition to the current rate, which averages about 6 inches per century.)
agupubs.onlinelibrary.wiley.com/doi/full/10.10
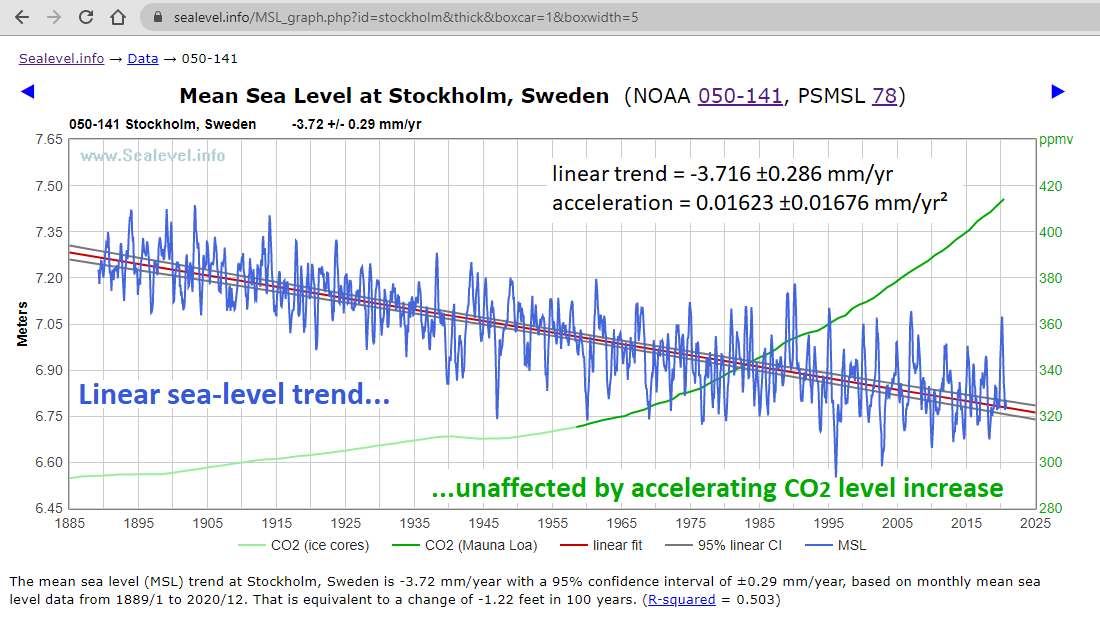
6/11. In fact, the "global" trend is so slow that in many places it's dwarfed by local factors, like erosion, sedimentation, and vertical land motion. Greta Thunberg's hometown is one of those places:
sealevel.info/MSL_graph.php?
sealevel.info/050-141_Stockh
For Stockholm, the main local factor affecting the local sea-level trend is isostatic rebound of the land, due to the retreat of the Fennoscandian Ice Sheet about 11K years ago.

7/11. If the global sea-level trend were to substantially accelerate, from its current approximately 1.5 mm/year (6 inches/century), that would be good news for Stockholm Harbor, because it would reduce their dredging expenses. Here's an article:
dredgingtoday.com/2014/03/07/swe

8/11. The best evidence shows that manmade climate change is modest and benign, and CO2 emissions are net-beneficial rather than harmful. Here are some relevant scientific papers:
sealevel.info/negative_socia

9/11. BTW, if you want to know what makes Honolulu such a great place to measure sea-level, I explained it here:
x.com/ncdave4life/st
Dave Burton@ncdave4life
Dave BurtonJun 10 24
View on Twitter
True!
There's never been an ice sheet near Oahu, so it's unaffected by Post-Glacial Rebound (PGR), and it experiences almost no vertical land motion (VLM).
(Aside: but it moves horizontally [NW] ≈3″/year!
nps.gov/havo/learn/nat )
Peltier's ICE-6G(VM5a) estimate is that Honolulu experiences just 0.10 mm/yr uplift.
sealevel.info/viewtxt2.php?P
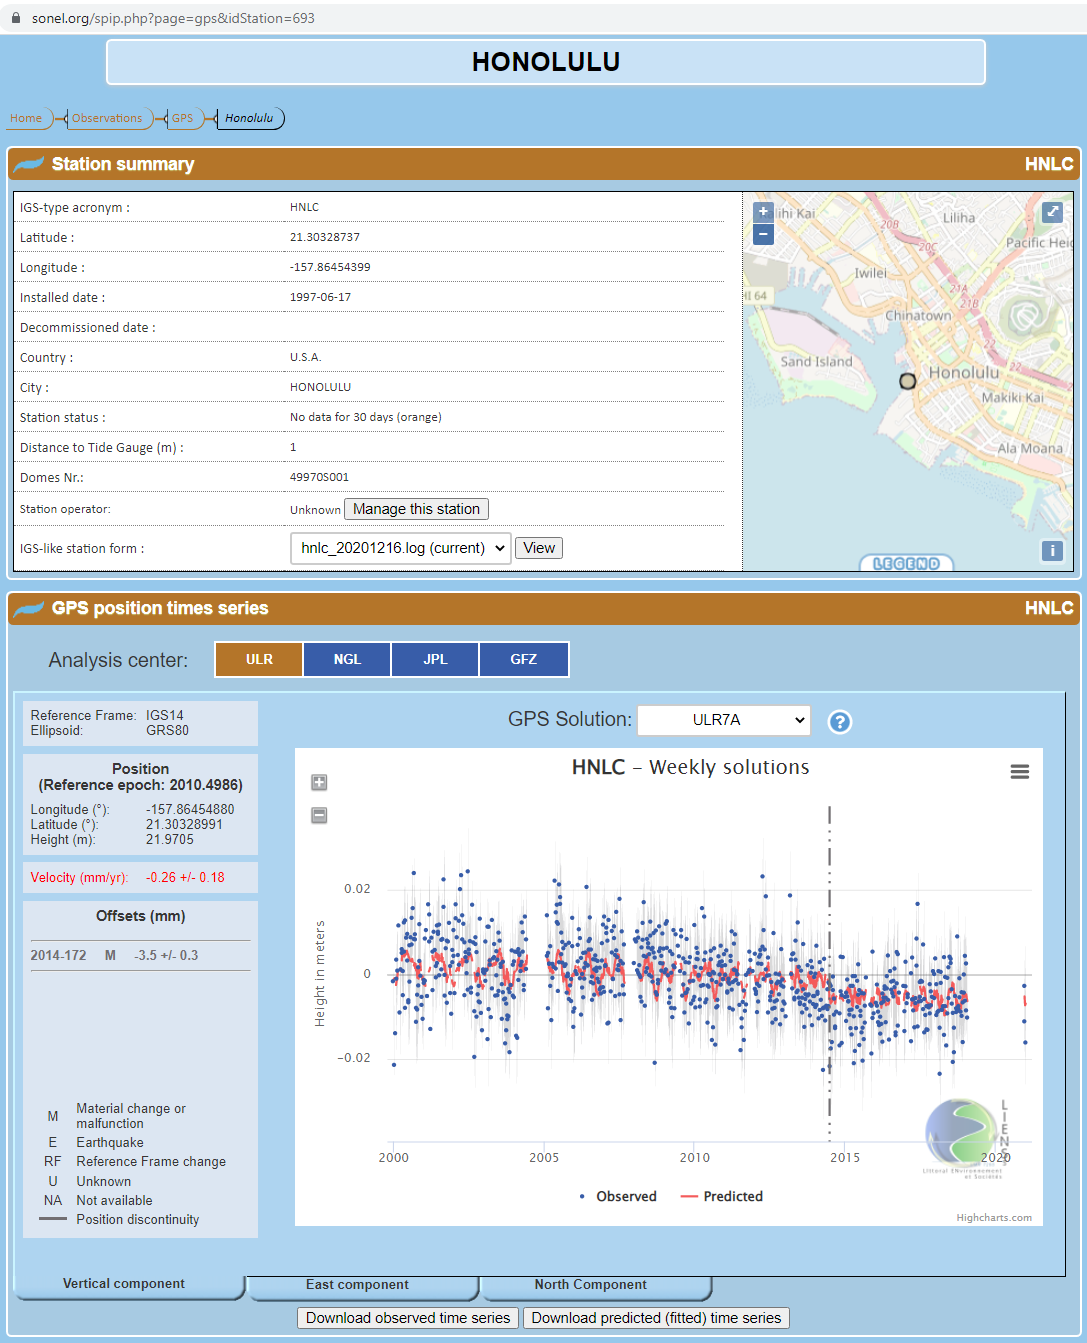
SONEL's analysis, from GPS data, indicates that Honolulu is subsiding (rather than rising), but at only 0.26 ±0.18 mm/yr:
sonel.org/spip.php?page=
Screenshot:
sealevel.info/Honolulu_HNLC_
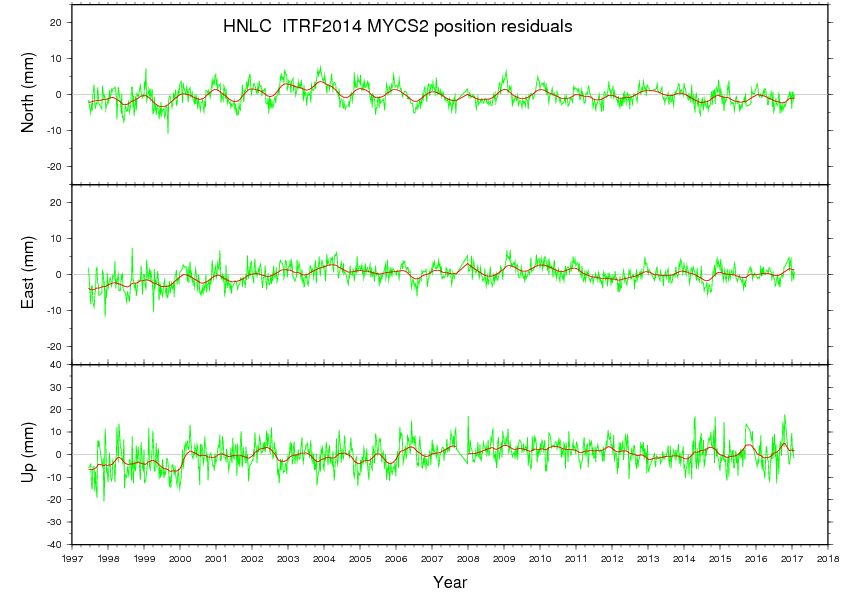
The CORS plot is flat as a pancake:
geodesy.noaa.gov/cgi-cors/CorsS)
Screenshot:
sealevel.info/hnlc_14.long.p
Those VLM numbers are tiny: +0.10 and -0.26 are opposite sign but close together. In other words, Peltier's model & SONEL's measurements agree that Oahu experiences little vertical land motion.
Also, Honolulu's long distance from Greenland also immunizes it from potential distorting effects of Greenland's evolving ice sheet on the Earth's gravity field (the “Greenland Gravity Effect”).
sealevel.info/resources.html
Here's an explanation of the Greenland Gravity Effect:
youtube.com/watch?v=XZqtXf
Also, Honolulu gets only fairly modest tides:
tidesandcurrents.noaa.gov/noaatidepredic
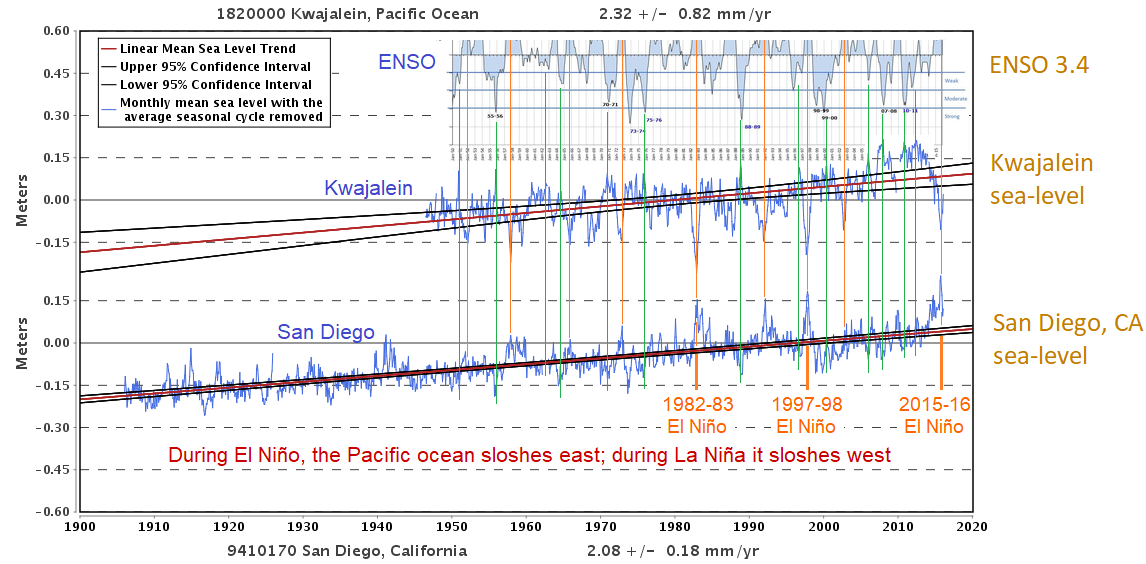
Also, its mid-Pacific location is near the pivot point of the east-west Pacific "teeter-totter," so it's little affected by ENSO "slosh" — that is, El Niño and La Niña don’t alter sea-level there very much.
(Aside: Easterly Pacific trade winds diminish during El Niño. Since the trade winds push the water west, diminished trade winds causes the Pacific ocean to "slosh" east. Thus El Niño raises sea-level in the eastern Pacific, e.g., at San Diego, and lowers sea-level in the western Pacific, e.g. at Kwajalein:
sealevel.info/resources.html
sealevel.info/1820000_Kwajal )
Also, of course, if you had to pick one place to sample the "global" sea-level trend, the middle of the world's biggest ocean would be the most obvious choice, and Honolulu is the only high quality, very long, sea-level measurement record from the mid-Pacific.
Plus, it has 119⅓ years of continuous measurements, without a single missing month!


10/11. If you want to know how @NASA Climate got this so spectacularly wrong (even though many NASA scientists do excellent work), see:
x.com/ncdave4life/st
Dave Burton@ncdave4life
Dave BurtonJun 10 24
View on Twitter
1/9. @NASA Climate is not one of the divisions & departments of NASA that do science. It's the "JPL Earth Science Communications Team" in Pasadena, which is comprised of "communicators," not scientists.
sealevel.info/learnmore.html
NASAClimate is a frequent source of misinformation and outright political propaganda.


NASA Climate@NASAClimate
Jun 08 24
View on Twitter
Sea levels are also rising at an accelerating rate. Right now, global sea level rises about 0.17 inches (0.42 centimeters) per year. For comparison, the 1993 rate was 0.07 inches (0.13 centimeters) per year.
11/11. To understand a contentious & politicized topic like climate change, you need balanced information. You won't get it from @NASA Climate, but I'm here to help. I've compiled a list of high quality resources, here:
sealevel.info/learnmore.html
It has:
● accurate introductory climatology information
● in-depth science from BOTH skeptics & alarmists
● links to balanced debates between experts on BOTH sides
● accurate information about impacts of CO2 & climate change, such as the effects on crop yields
● links to the best blogs on BOTH sides of the climate debate

Dave Burton
Dave Burton@ncdave4life
My preferred pronoun is "harmless data drudge." https://t.co/YTkK6vaHGs Tel: +1 919-481-0098.
Missing some tweets in this thread? Or failed to load images or videos? You can try to .