


 Dave Burton@ncdave4life
Dave BurtonJun 12, 2024
7 tweets
1/7. Paul, Sealevel.info is my very sunny site. If you find errors on it I'll be sincerely grateful if you tell me. (See "About" for contact info.)
But the graph I used is from NOAA.
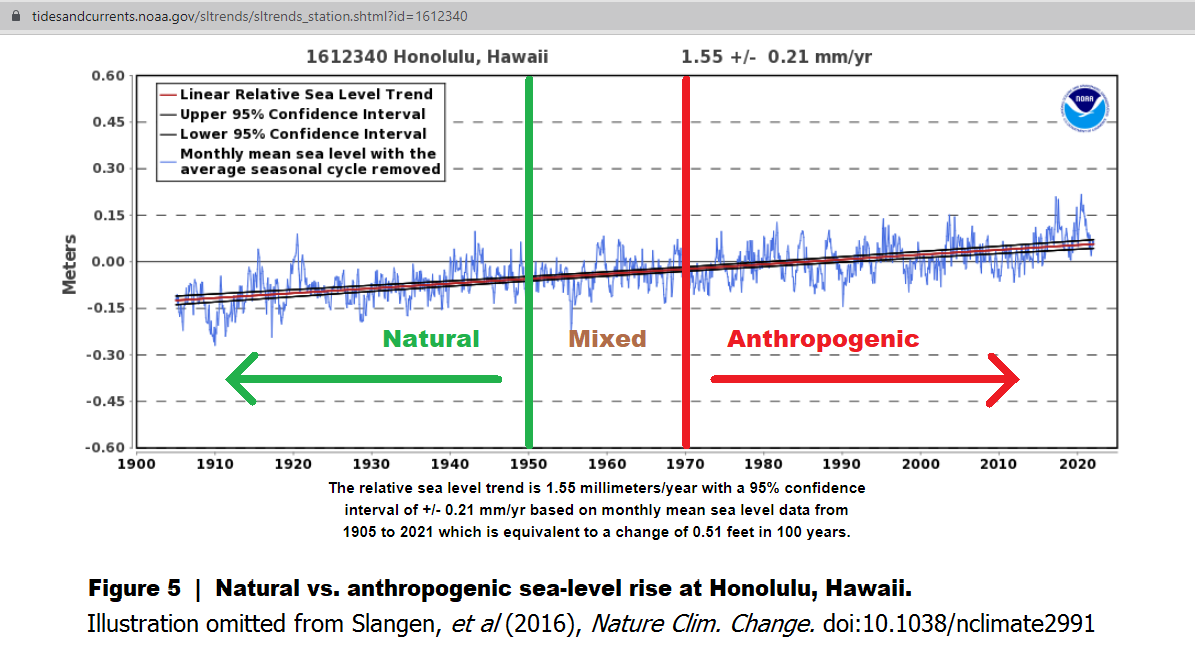
My caption says, "Illustration omitted from Slangen et al (2016)…"
Is that unclear?
sealevel.info/1612340_Honolu

2/7. I gave you the link to the source for NOAA's graph:
tidesandcurrents.noaa.gov/sltrends/sltre
Did you overlook it?
I added the red, green & brown annotation, and bottommost caption, based on Slangen's reported conclusions.

3/7. I also gave you the link to the graph on my site:
sealevel.info/MSL_graph.php?
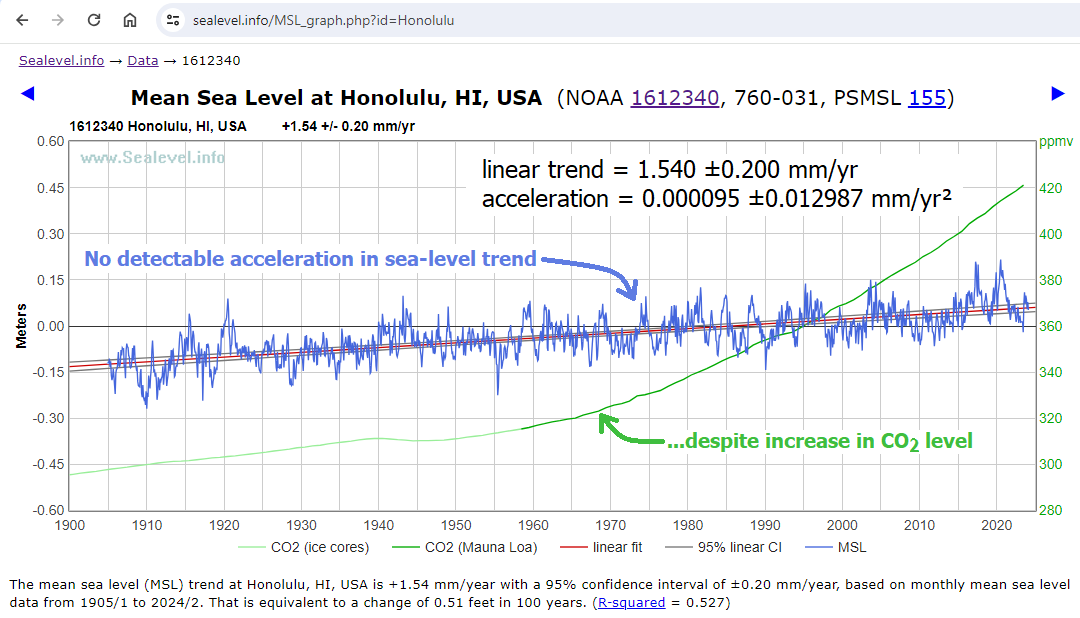
As both sites report, the linear trend is 1.54 ±0.20 mm/yr (which is 6 inches per century).
NOAA doesn't calculate/report acceleration, but I do. The acceleration there is 0.000 ±0.013 mm/yr².
sealevel.info/1612340_Honolu

4/7. My point was that Slangen should have included a graph like that, which shows what her conclusion implies about the causes of measured sea-level trends. She didn't, of course, presumably because that would've made it too obvious how absurd her conclusion was.
5/7. Here's how Slangen attributes Sydney's sea-level rise:
sealevel.info/680-140_Sydney
Here's how Slangen attributes Honolulu's sea-level rise:
sealevel.info/1612340_Honolu
I hope it is clear how nonsensical that is.


6/7. I have no idea why you think "measuring in Honolulu is not viable."
I disagree.
NOAA obviously disagrees, too, because they've been doing it for 119 years.
x.com/ncdave4life/st
Dave Burton@ncdave4life
Dave BurtonJun 10 24
View on Twitter
9/11. BTW, if you want to know what makes Honolulu such a great place to measure sea-level, I explained it here:
x.com/ncdave4life/st

Paul Schmidt@_PrinceOfMilk
Jun 12 24
View on Twitter
The Website is especially shady when you consider that the Guy that posted it made it himself. The Graph is also not in the Study so this guy mustve made an Own graph and then pasted the DOI of the Study onto it.
Not to mention that measuring in Honolulu is not viable.
7/7. To understand a contentious & politicized topic like climate change, you need balanced information. To that end, I've compiled a little list of high quality resources, here:
sealevel.info/learnmore.html
It has:
● accurate introductory climatology information
● in-depth science from BOTH skeptics & alarmists
● links to balanced debates between experts on BOTH sides
● accurate information about impacts of CO2 & climate change, such as the effects on crop yields
● links to the best blogs on BOTH sides of the climate debate

Dave Burton
Dave Burton@ncdave4life
My preferred pronoun is "harmless data drudge." https://t.co/YTkK6vaHGs Tel: +1 919-481-0098.
Missing some tweets in this thread? Or failed to load images or videos? You can try to .