


 Dave Burton@ncdave4life
Dave BurtonJul 10, 2024
7 tweets
1/7. Christopher wrote, "Energy balances, not heat, not a flux."
Flux just means flow or movement. "Energy flux" is synonymous with "movement of energy."
Inbound solar radiation is a flux. So is outbound LW IR.
Definitions:
1. ahdictionary.com/word/search.ht
2. scienceworld.wolfram.com/physics/Flux.h
2/7. If you call incoming fluxes positive and outgoing fluxes negative, then an "energy imbalance" simply means incoming plus outgoing fluxes do not sum to zero.
Persistent energy imbalance causes temperature change. That gives us clues to estimate EEI.
sealevel.info/radiative_imba

3/7. Willard wrote, "The what matter's is the Earth's overall energy imbalance (EEI)"
If it REALLY mattered to Willard, he wouldn't play make-believe with it.
x.com/ncdave4life/st
Dave Burton@ncdave4life
Dave BurtonApr 15 24
View on Twitter
2/2. The spreadsheet does calculations. That's all.
x.com/ncdave4life/st
Most climate alarmists uncritically accept estimates of basic climate parameters, like TCR, ECS, ERF, radiative imbalance, etc. without bothering to check them for consistency. That's a big mistake.
The result is that often they're like the White Queen, believing many contradictory things, except that, unlike the White Queen, they don't know it.
The spreadsheet makes it easier to check your assumptions for (in)consistency.

4/7. Willard wrote, "Chris That imbalance is growing EEI measured by 2 independent means (CERES satellite data & ocean heat content)"
That's 2× false.
We've been over this!
In the 1st place, CERES does not measure EEI:
x.com/ncdave4life/st
Dave Burton@ncdave4life
Dave BurtonFeb 28 24
View on Twitter
⸨1/2⸩ CERES satellites can't measure Earth's energy balance (a/k/a ERB, Earth's radiation balance). CERES instruments point down. They only (sparsely!) sample outgoing radiation fluxes. They don't measure incoming radiation.
We've been over this before
x.com/ncdave4life/st
5/7. In the 2nd place, OHC guesstimates are extremely rough.
x.com/ncdave4life/st
Since ≈2005 OHC estimates are informed by very sparse temperature measurements.
Before that there were no measurements from which OHC could be estimated globally to anywhere near the accuracy needed to estimate EEI from it.
Dave Burton@ncdave4life
Dave BurtonJun 18 24
View on Twitter
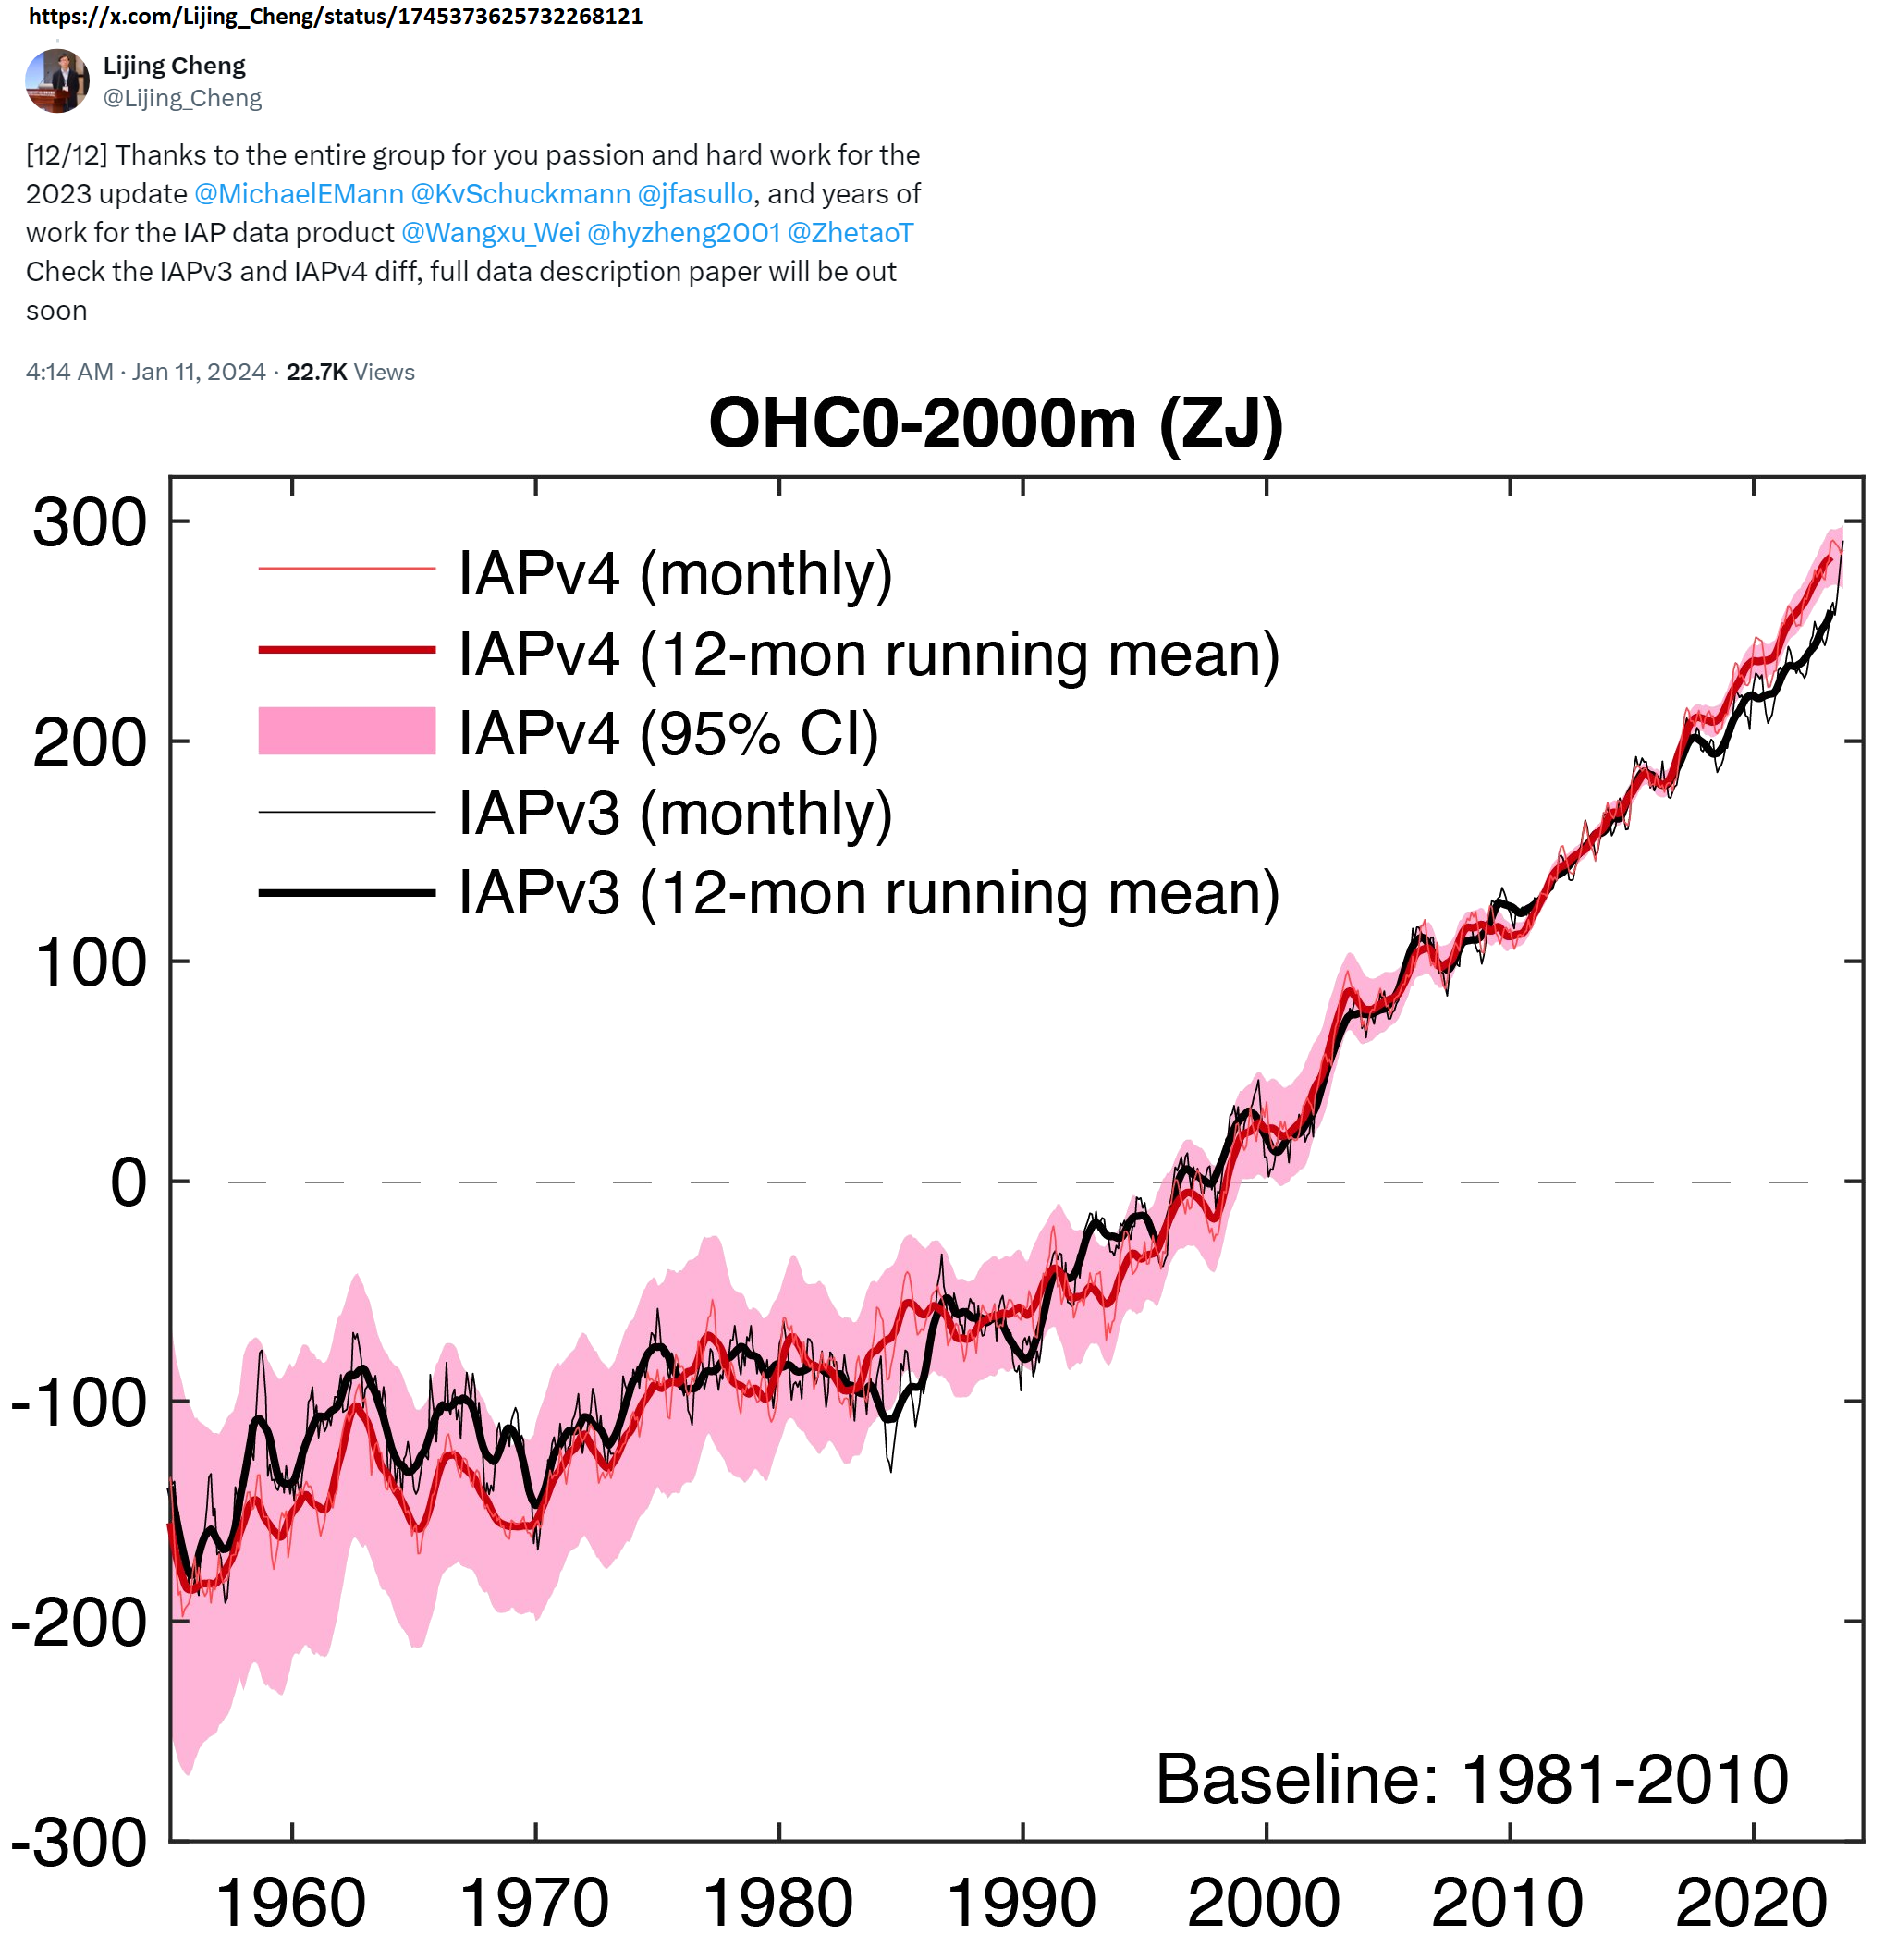
What it shows is that there was no data from which OHC to 2000 meters could estimated in the 1950s-60s. That means those early OHC figures are just guesses. (That might be why, unlike Cheng, Meyssignac et al don't show any graphs of OHC estimates extended back before about 1995.)
6/7.
Q: What's the difference between these two things?
A: One of them is a great big steaming pile of BS. The other is fertilizer. sealevel.info/pile_of_steami
sealevel.info/IAPv3_v_IAPv4_
(Okay, that's a bit harsh, because the part after 2005 is not total BS.)
x.com/ncdave4life/st


Dave Burton@ncdave4life
Dave BurtonJun 18 24
View on Twitter
 /
/ . That graph shows an estimate of a total of about 500 ZJ added to the the upper 2 km of the oceans since 1955.
Aside: Actually, the first 50 years of the graph are nothing but guesses.
OHC is estimated by models, informed by temperature measurements, made by Argo floats. The first Argo float was deployed in 2000. They didn't reach 3000 units (i.e., one float per 120,000 km²) until 2007.
So the part of their graph prior to about 2005 is 100% codswallop. The kindest thing you can say about it is that it's a plausible guess, consistent with (but you can't say based upon!) convenience samples of sea surface temperatures. It is not data, in any sense.
But never mind that, because that graph also has another problem...
. That graph shows an estimate of a total of about 500 ZJ added to the the upper 2 km of the oceans since 1955.
Aside: Actually, the first 50 years of the graph are nothing but guesses.
OHC is estimated by models, informed by temperature measurements, made by Argo floats. The first Argo float was deployed in 2000. They didn't reach 3000 units (i.e., one float per 120,000 km²) until 2007.
So the part of their graph prior to about 2005 is 100% codswallop. The kindest thing you can say about it is that it's a plausible guess, consistent with (but you can't say based upon!) convenience samples of sea surface temperatures. It is not data, in any sense.
But never mind that, because that graph also has another problem...
Christopher Collins@CDCollins5269
Jul 10 24
View on Twitter
 How many times are you going to repeat the same tripe? What "imbalance" 1k average in and out. Fluxes will never balance in and out of the planet. Ever. Energy balances, not heat, not a flux. Climate science loves to play fast and loose with fluxes.
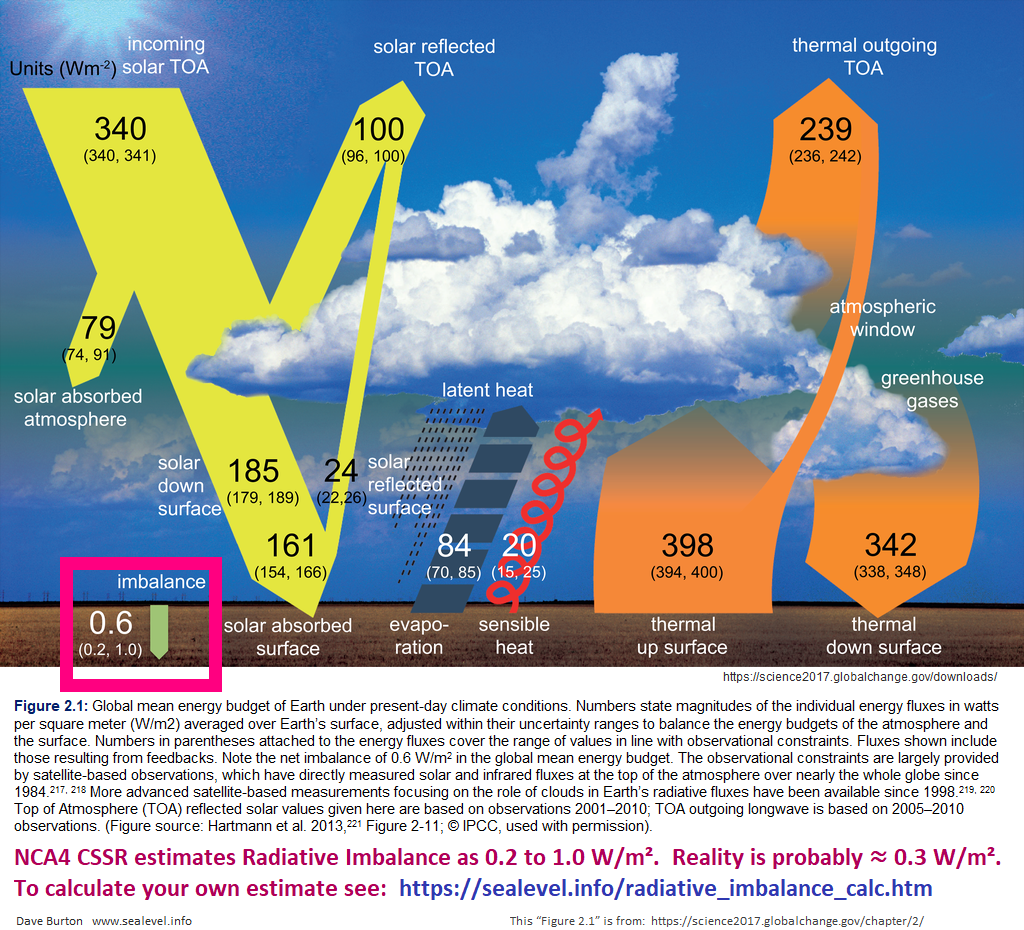
7/7. Earth's average radiative imbalance (EEI) is probably about 0.3 W/m². But that's an estimate, from various clues. EEI is not measured.
x.com/ncdave4life/st
sealevel.info/NCA4_global_en

Dave Burton@ncdave4life
Dave BurtonFeb 28 24
View on Twitter
⸨2/2⸩ However, there are clues from which estimates of ERB can be derived.
x.com/ncdave4life/st
I created a spreadsheet to make it easy for you to calculate your very own estimate of Earth's radiation imbalance:
sealevel.info/radiative_imba

Dave Burton
Dave Burton@ncdave4life
My preferred pronoun is "harmless data drudge." https://t.co/YTkK6vaHGs Tel: +1 919-481-0098.
Missing some tweets in this thread? Or failed to load images or videos? You can try to .