
@Puͣkiͧte̍.com  @WHUT
@WHUT
May 28, 2025
16 tweets
What's totally screwed up is long-period tides (>=2 weeks). These impact large scale SLH cycles via fluid dynamics. Start with long record (>100 year) sites, such as Ft Denison in Sydney harbor.
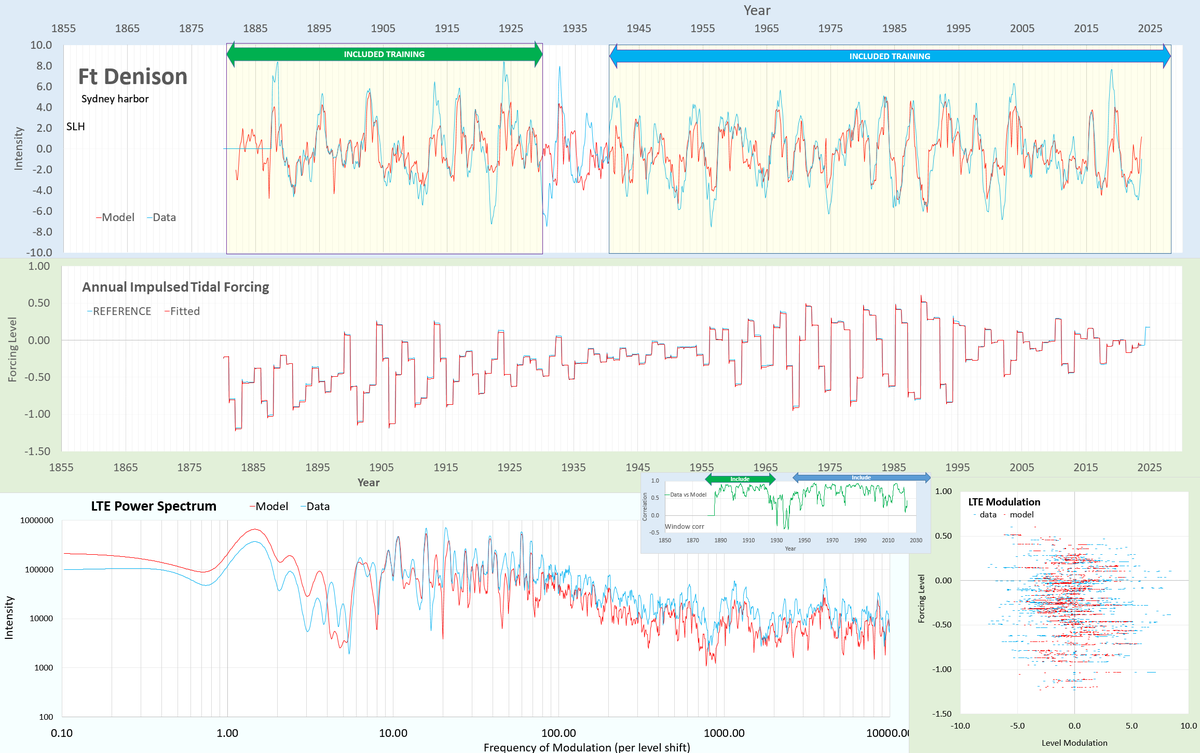
Look at SLH at Brest in France -- same tidal forcing (middle panel) but different response. Using a cross-validated interval for testing

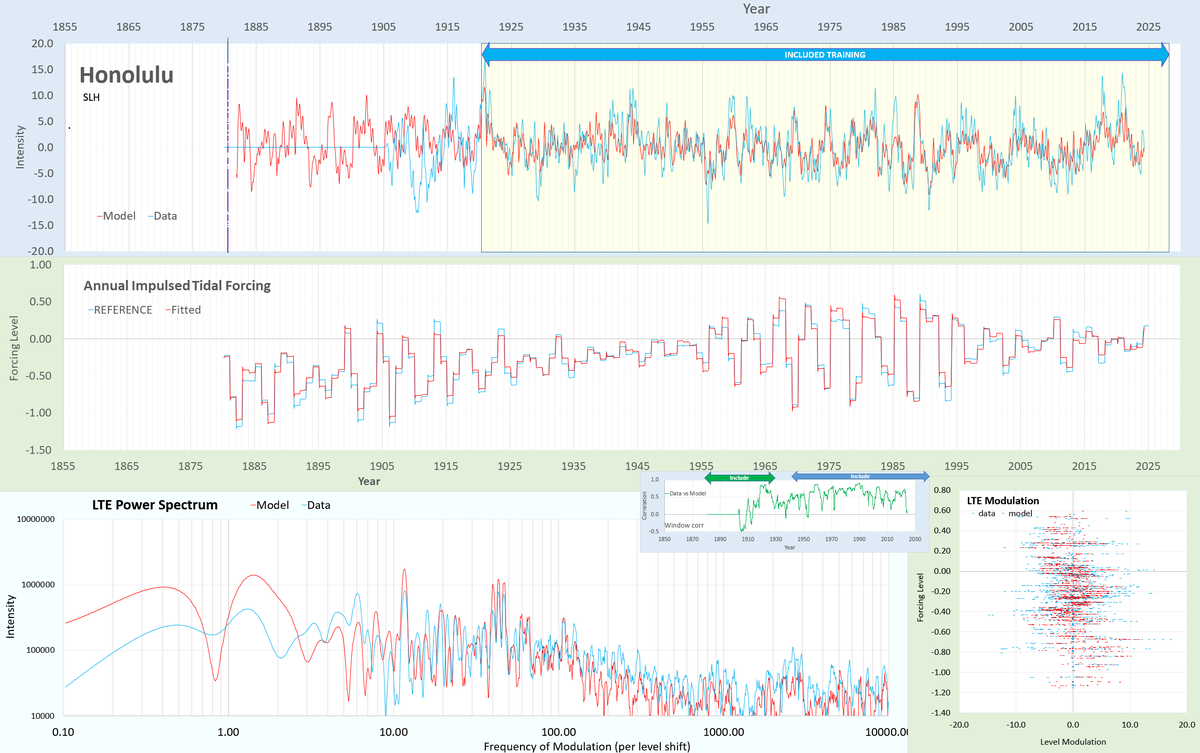
Go to Honolulu SLH measurements, still the same tidal forcing. Unique response, starting to look like a machine learning candidate.
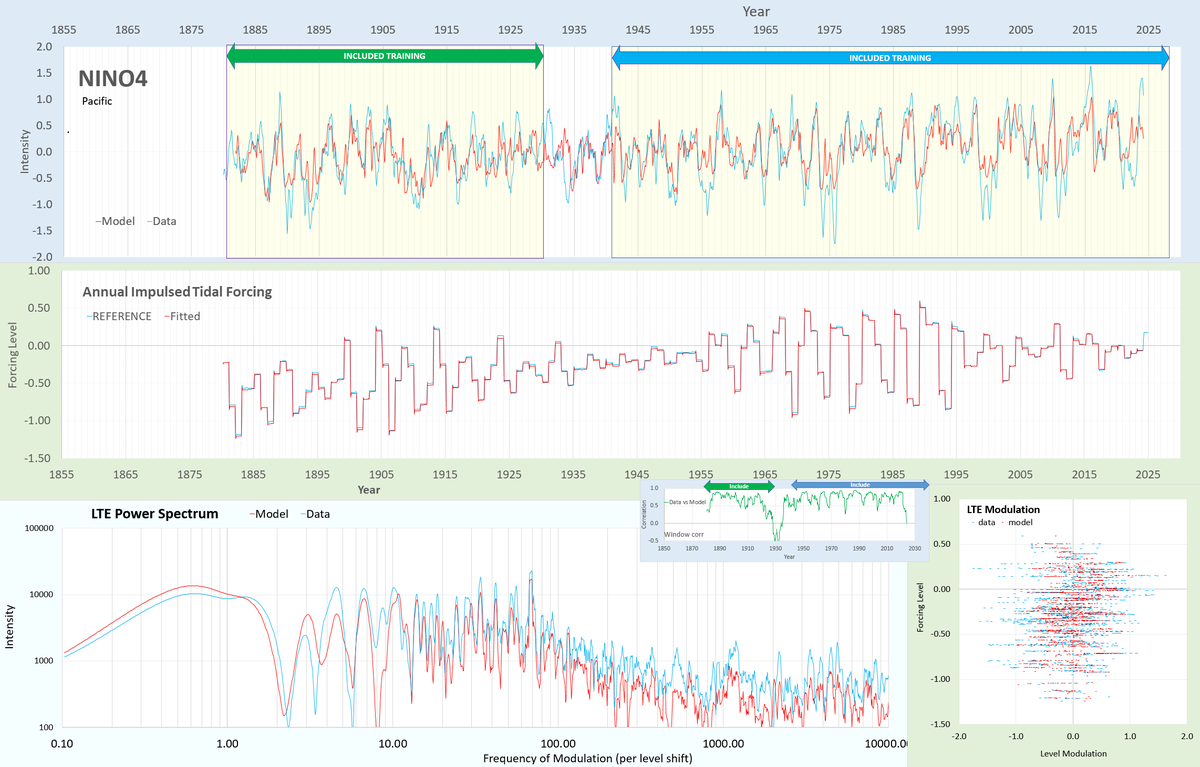
Now it gets weird. Start modeling large oceanic cycles. Obvious first candidate is ENSO, using the NINO4 index of SST. Promising cross-validation, same tidal forcing in middle panel
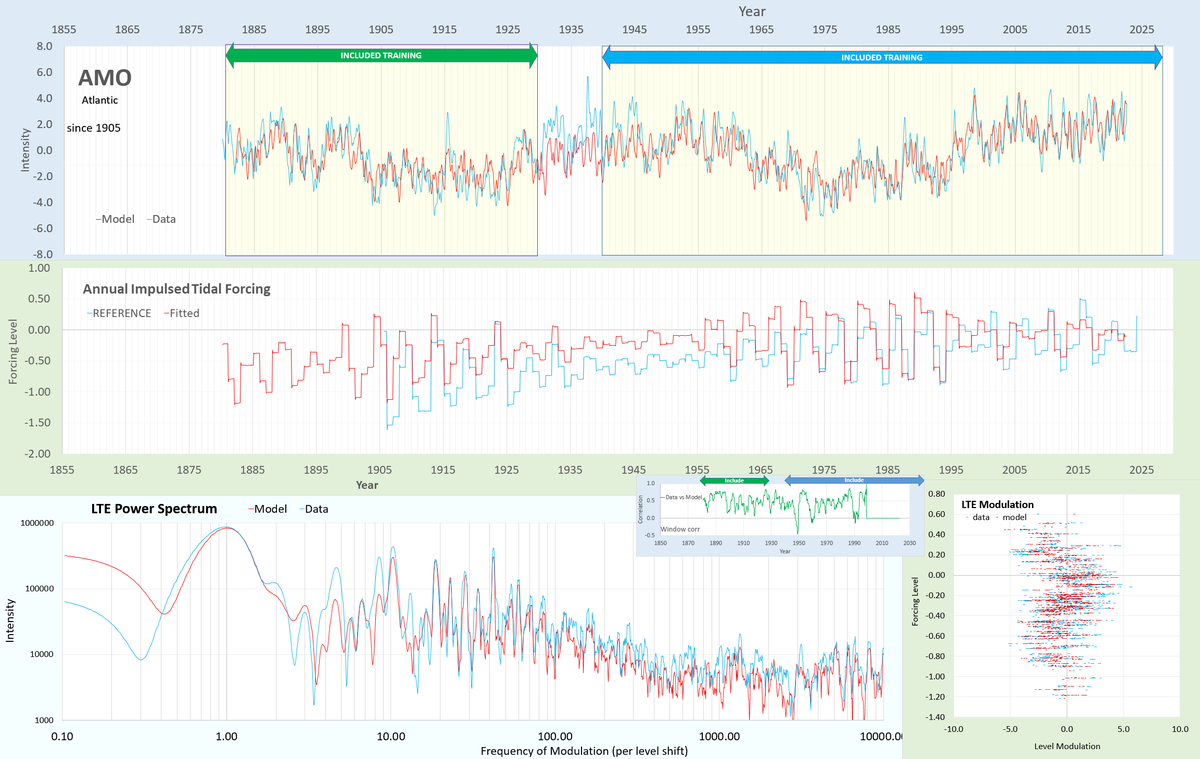
Flip over to Atlantic with AMO. The multidecadal tidal forcing is latent but emerges after training. Despite the reference curve in the middle panel, the tidal forcing is still identical.
Try the NAO in the North Atlantic. Tis requires some averaging since the raw NAO is noisy. Same tidal forcing.

The Tropical North Atlantic (TNA) index. Has a clear warming trend, which is modeled separately from the variability

The Tropical South Atlantic (TSA). Captures part of the strong spike in 2023-2024. Same tidal forcing, unique response captured by Laplace's Tidal Equation (LTE) fluid dynamics solution, lower panels.

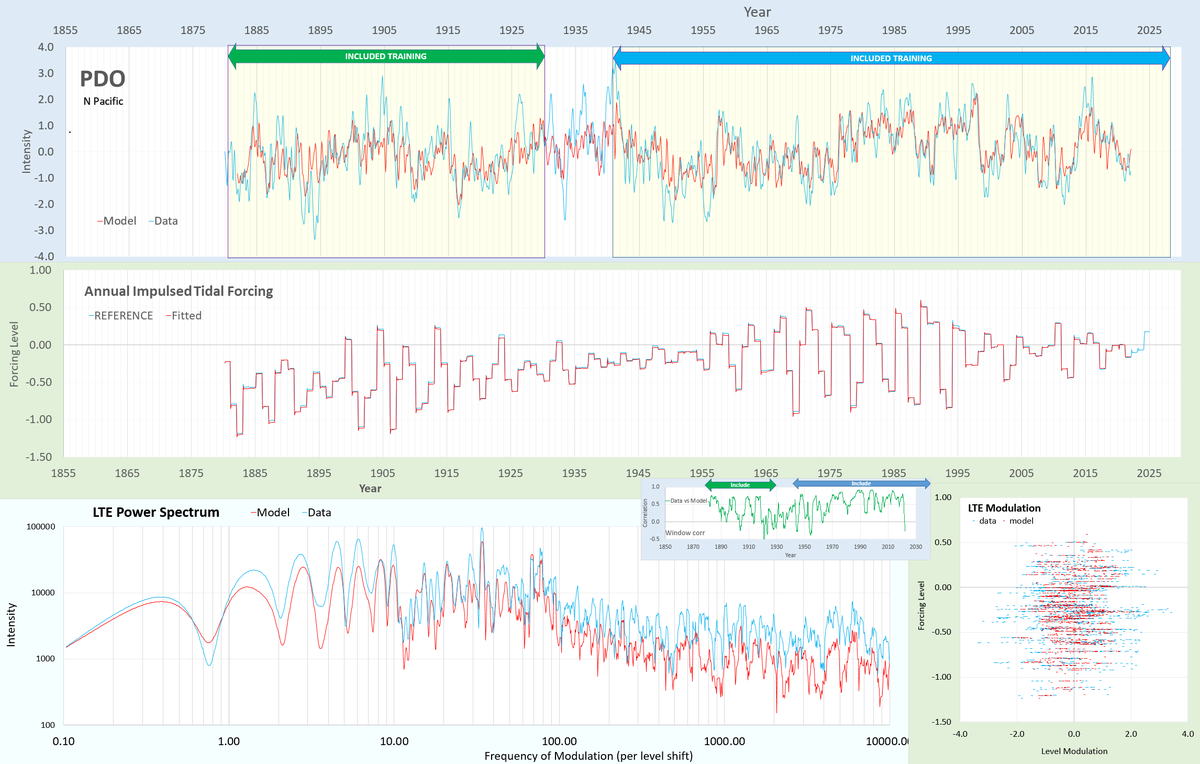
Head back to the Pacific for the PDO in the north. Similar to ENSO in some ways, but more decadal behavior. Same forcing
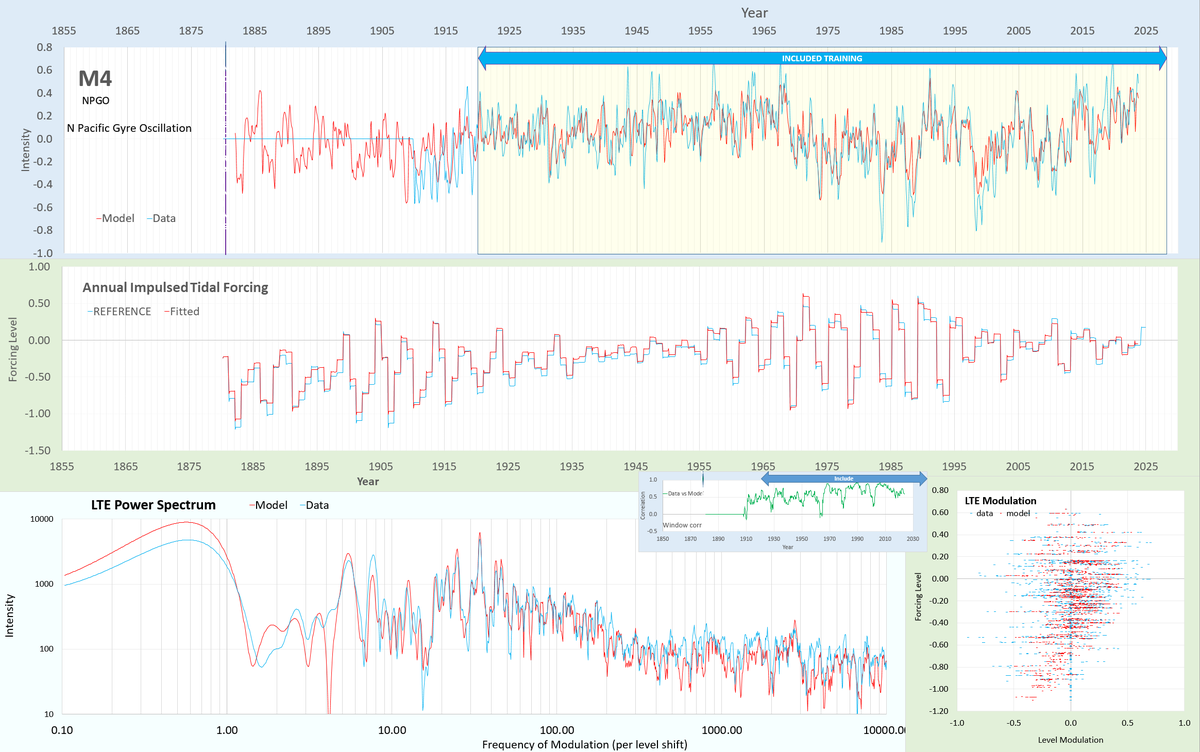
A very interesting but lesser known index, the North Pacific Gyre Oscillation (NPGO) aka M4. Crazy the amount of detail that the LTE response modulation picks up. Slight variation in the tidal forcing
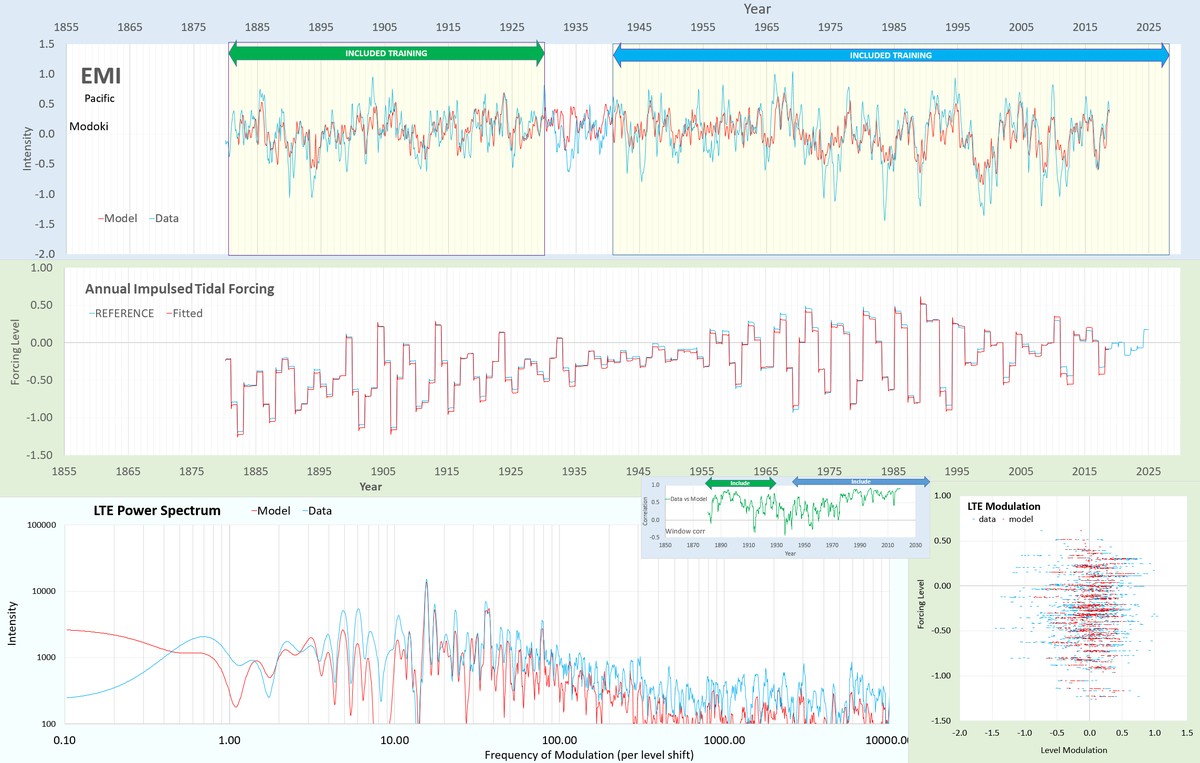
The EMI or Modoki index, related to ENSO but some character of the NPGO. Again, decent cross-validation in the test interval. Without CV, could be over-fitting but not likely given all the success so far.
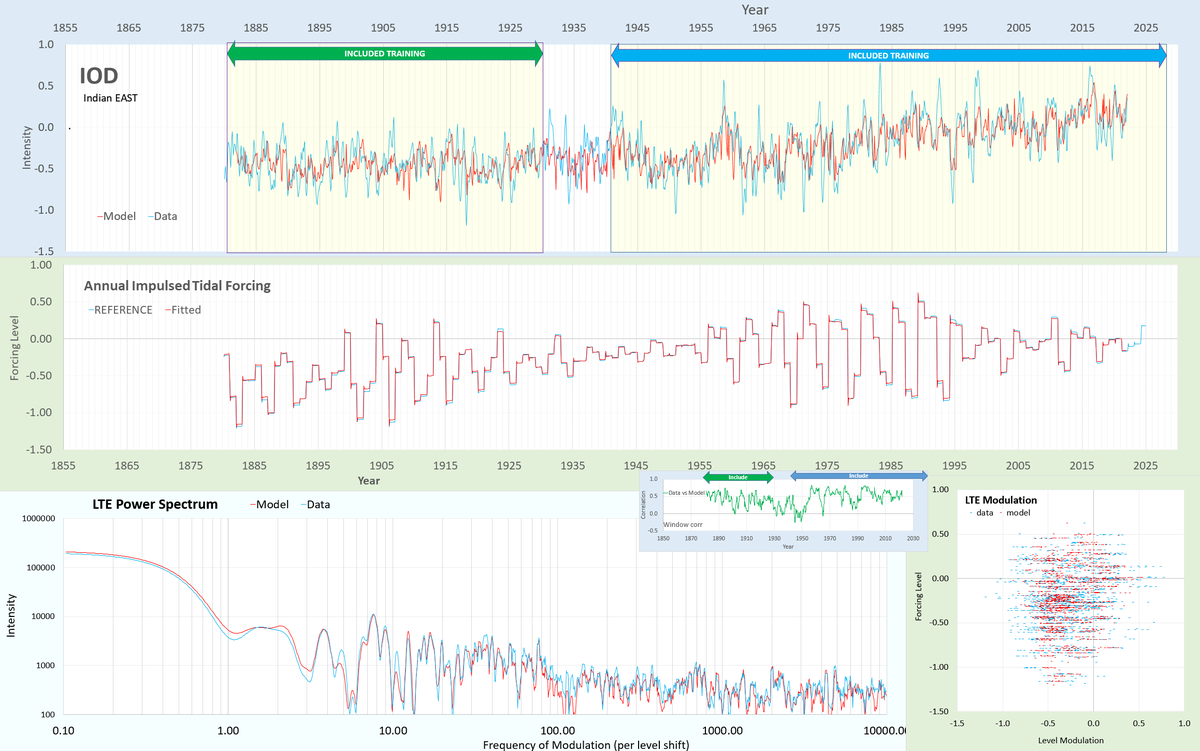
On to the Indian ocean, the East part of the Indian Ocean Dipole (IOD). Trend appears here as well, still with good CV and maintaining the same tidal forcing in the middle panel.
The western dipole of the IOD, has a stronger trend, but still good CV with same tidal forcing.

Last index is the Darwin measure of atmospheric pressure, related to ENSO and half of the SOI dipole
Same tidal forcing, response with subtle details differing from NINO4.
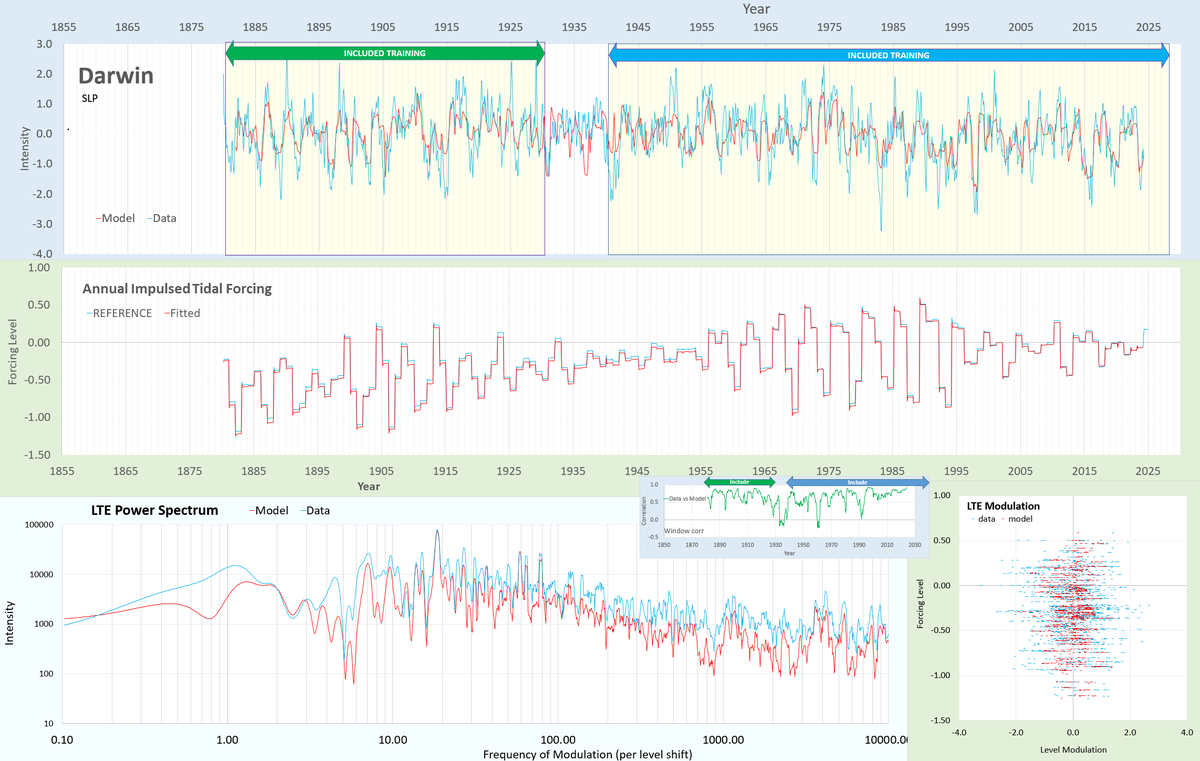
What does this all mean? SLH measurements would imply that tidal forcing should be an obvious candidate. But for the ocean indices, the ocean's thermocline also is subject to tidal forcing especially in such a reduced gravity environment. The 2 interact via inverse barometer.

teo_naudomoi@teo_naudomoi
May 26 25
View on Twitter

The machine learning community needs to be let loose on this data. The tidal forcing is a latent or hidden layer that ML models such a SINDy, KAN, and others could easily handle. I don't use ML other than to fit the models with known tidal factors - ManMachineLearning so far.

@Puͣkiͧte̍.com
@WHUT
whut's happening? → Earth Sciences 🌏
Mathematical GeoEnergy (Wiley/AGU, 2019) 🌊
https://t.co/IGGOHc2YC1
https://t.co/v9iiFNoYzq
Missing some tweets in this thread? Or failed to load images or videos? You can try to .