
Tara Moriarty@MoriartyLab
Jul 4, 2025
29 tweets
Canadian COVID Forecast: Jun 28-Jul 11, 2025
SEVERE: none
VERY HIGH: none
HIGH: ON
MODERATE: CAN, AB, BC, MB, NB, NL, North, NS, PEI, QC, SK
About 1 in 120 people in Canada are CURRENTLY infected.

Notre aperçu national en français :
x.com/MoriartyLab/st
Tara Moriarty@MoriartyLab
Jul 04 25
View on Twitter
Prévisions de COVID pour le Canada : JUN 28-JUL 11, 2025
GRAVE : aucun
TRÈS ÉLEVÉ : aucun
ÉLEVÉ : ON
MODÉRÉ : CAN, AB, CB, MB, NB, TNL, Nord, NÉ, ÎPÉ, QC, SK
Environ 1 personne sur 120 est actuellement infectée au Canada.

WHAT'S NEW THIS WEEK?
Forecast scores are stable and moderate in most provinces.
About 1 in 120 people in Canada is currently infected (33,000-43,000 infections/day).


Hospitalizations and deaths are stable (-2 to 0% per week across Canada).
Expected excess mortality due to COVID-19 in Canada is MODERATE (5%, Forecast score 5).


Infections in Canada this week are expected to result in 1,100 hospitalizations, 230 deaths (people who die at least 1 year earlier than they would without COVID) and 8,400 new long COVID cases serious enough to limit daily life activities.


About 2.6% of people in Canada are infected and/or experiencing life activity-limiting long COVID this week.
The estimated cost of hospitalizations from this week's infections in Canada is $24.1M.


Hospitalizations are expected to require 1.7% of Canada's staffed hospital beds for three weeks (CIHI: average duration of COVID hospitalizations: cihi.ca/en/covid-19-ho ).

CONFIDENCE OF ESTIMATES
The confidence interval for infection estimates this week is -/+ 13%.
The last date when comparison data for the UK are available from ONS and Ward et al 2024 is Feb 26/23: nature.com/articles/s4146
From Dec 5/21 to Feb 26/23, median weekly infection prevalence, infection fatality and hospitalization rates for Canada are similar to median weekly UK values (prevalence 1.00X UK, IFR 1.03X UK, IHR 0.99X UK; p>0.05).
FOCUS ON PROVINCES: NEWFOUNDLAND AND LABRADOR
The Forecast score this week is 4.3 (MODERATE).
Infections in the province this week are expected to result in 3 deaths, 16 hospital admissions and 110 new daily life activity-limiting long COVID cases.
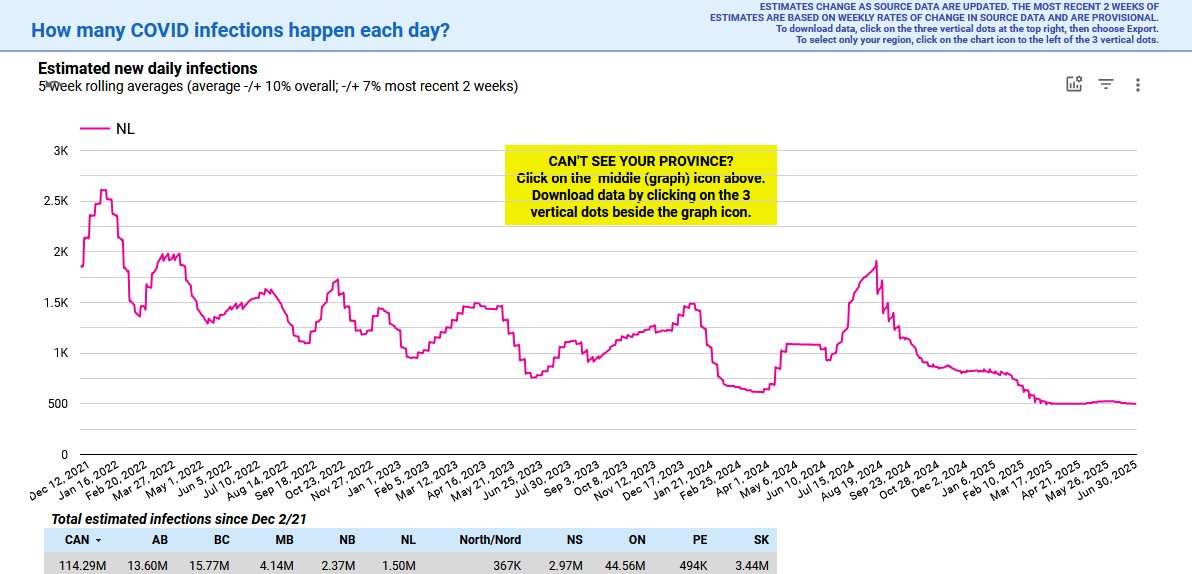

About 2.5% of people are infected and/or experiencing daily life activity-limiting long COVID this week.
The estimated cost of hospitalizations from this week's infections in the province is $356K.

Hospitalizations are expected to require 1.2% of staffed hospital beds for three weeks (CIHI: average duration of COVID hospitalizations).
According to the most recent COVID-19 vaccination coverage data from PHAC, 3.0% of people in the province are vaccinated against COVID-19 according to recommendations: health-infobase.canada.ca/covid-19/vacci
The Canadian average is 3.9%.
Since Dec 5, 2021, Newfoundland and Labrador has publicly reported 23% of 7,900 expected COVID-19 hospitalizations and 28% of 1,651 expected deaths (people who die from COVID-19 at least 1 year prematurely).
Quebec is Canada's best-reporting province.
Since Dec 5, 2021, Quebec has reported 100% of expected hospitalizations and 46% of expected deaths.
Newfoundland and Labrador has reported <23% of hospitalizations reported by Quebec, and 50% of deaths reported by Quebec.
NEXT FORECAST DATE: August 9, 2025.
Please join us virtually on August 12 at 8 p.m. ET for a Data Discussion of the latest changes to the Forecast model as the sources of data available to us continue to dwindle.
Register in advance for this meeting:
(Select Aug 12, 2025 in dropdown box)
us06web.zoom.us/meeting/regist
The CSA Z94.4:2024 Selection, use and care of respirators draft standard has been posted for a 60-day public review period.
If this standard is adopted, respirators will be required in health care settings by default. Your feedback can help.
Here are some of the proposed changes to improve workplace safety in healthcare settings:
 surgical masks should not be used for respiratory protections
elastomeric respirators are to be put into widespread use & there are several situations where they are the preferred option vs N95
surgical masks should not be used for respiratory protections
elastomeric respirators are to be put into widespread use & there are several situations where they are the preferred option vs N95
surgical masks should not be used for respiratory protections
elastomeric respirators are to be put into widespread use & there are several situations where they are the preferred option vs N95 every worker in healthcare settings is to use a respirator, no longer just HCWs
patients are to be given respirators and only given surgical masks if unable to wear a respirator
respirators are to be worn in all areas and at all times unless it’s an area with high air exchange ratesCSA Group is a Standards Development Organization that develops standards and testing protocols for industrial products and workplaces.
Their standards are often, but not always, adopted by the Standards Council of Canada.
Each standard is reviewed at least every five years, and before any standard is finalized, it is offered up for public review.
The closing period for public review is August 19th, 2025. publicreview.csa.ca/Home/Details/5
@ᒪᐢᑭᑭᓂᑲᒧᐣ ᐃᐢᑫᐧᐤ 😷 is having a virtual Full Moon circle for COVID-conscious women on Wednesday, July 9th.
Join here, it’s PWYC: eventbrite.ca/e/full-moon-he

COVID outbreak risk remains in #ONhealth hospitals without layers of protection.
Universal masking in ALL areas of #Ontario hospitals is essential for safe healthcare access.
Let regional decision-makers know this is a priority.
@Safe Care Ontario Take action:
safecare.initiative.works

The regional Canadian COVID forecast can be found here:
x.com/MoriartyLab/st
Tara Moriarty@MoriartyLab
Jul 04 25
View on Twitter
Canadian COVID Forecast Jun 28-Jul 11, 2025
CANADA
MODERATE (no change)
About 1 in every 120 people infected
Compared to lowest point of pandemic in Canada:
-Infections ~5X higher
-Long COVID ~7X higher
-Hospitalizations ~5X higher
-Deaths ~4X higher

For links to resources, explanations of the forecast methods, and past forecasts, please see our pinned  here:
x.com/MoriartyLab/st
here:
x.com/MoriartyLab/st
here:
x.com/MoriartyLab/stRemember, the forecast reflects not only recent input data, but also numbers expected for the next 2 weeks, based on 5-week average trends.
The next forecast will be August 11th, 2025.
Thanks to @Pam Gaines #nosuchthingasmildcovid @CircaLiz @Brittany @Jeweljam_ILF @Ryan and @allenescott for data input, graphics, and translation.
Thanks to the whole COVID-19 Resources Canada team for weekly feedback and for keeping all our work going.
#TogetherWeCan

Tara Moriarty
@MoriartyLab
🏳️🌈🇨🇦Assoc Prof @UofT. Bloodborne infections, Lyme disease, misinfo. @COVID_19_Canada. Defend journalism. Opinions mine. @MoriartyLab.bsky.social
Missing some tweets in this thread? Or failed to load images or videos? You can try to .