
Mike Hoerger, PhD MSCR MBA@michael_hoerger
Jan 15
9 tweets
The Midwest presently has the highest levels of SARS-CoV-2 transmission in the U.S.
Using CDC wastewater surveillance data, we estimate infection prevalence in each state, e.g., 1 in 21 residents in MI and OH actively infectious.
Let me walk you through the numbers...
 1/9
1/9
1/9 
The CDC has #Illinois with Very High COVlD levels, including in the #Chicago area.
By linking wastewater surveillance data with IHME true case estimates, we project 1 in 27 residents are actively infectious. That's a 61% chance of exposure in a room of 25 people.
2/9
2/9 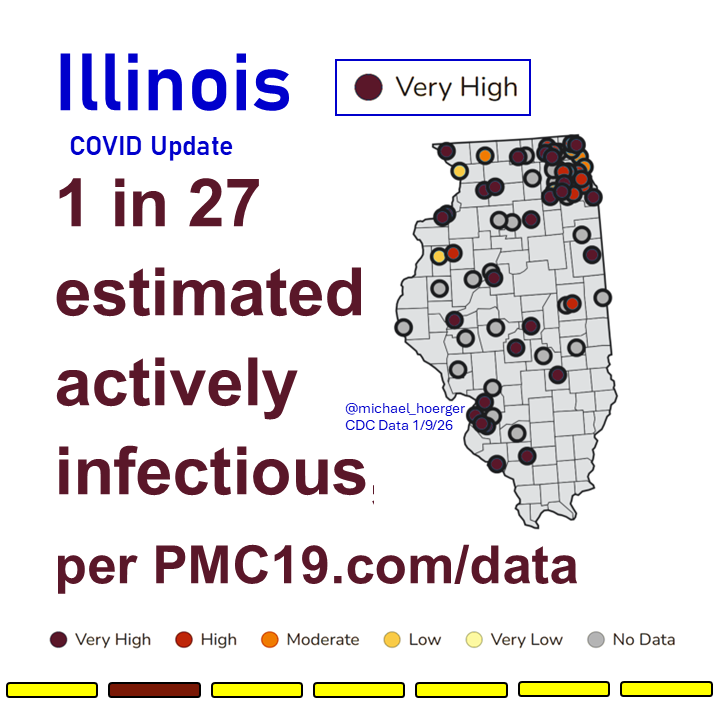
Data are quite limited in #Missouri, but the one CDC site reporting indicates Very High COVlD levels, consistent with adjacent states.
We estimate roughly 1 in 22 people are actively infectious, meaning a 68% chance of exposure in a room of 25 people.
3/9
3/9 
In #Michigan, COVlD levels are Very High, per the CDC.
We estimate 1 in 21 people are actively infectious. This translates into a 70% chance of exposure in a room of 25 people of typical infection risk.
4/9
4/9 
Likewise, the CDC reports COVlD levels are Very High in #Ohio, which has excellent surveillance.
We estimate 1 in 21 people actively infectious, or a 70% chance of exposure in a room of 25 people.
5/9
5/9 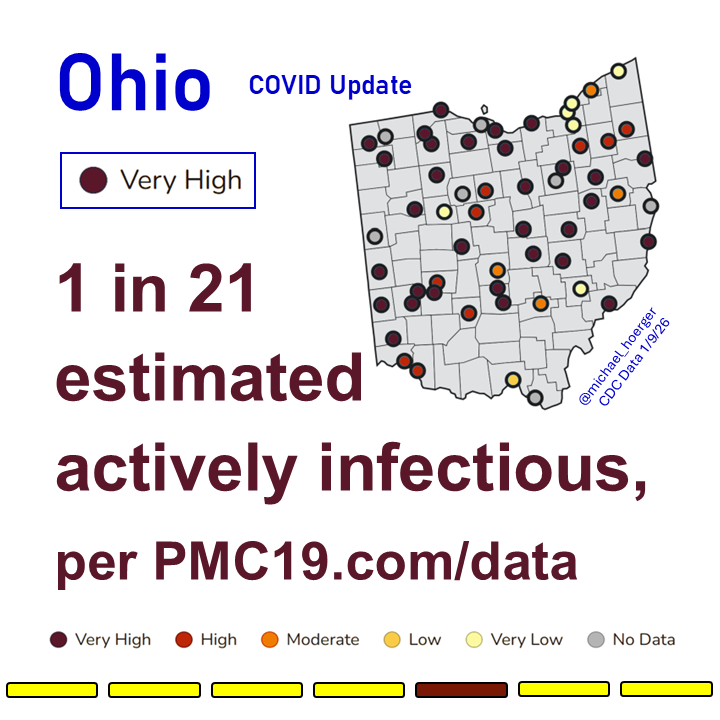
#Indiana has Very High COVlD levels, per the CDC.
We estimate 1 in 15 residents are actively infectious. In a room of 25 people of average infection risk, that's an 83% chance of an exposure.
6/9
6/9 
The CDC has #WestVirginia with Very High COVlD levels. The data are quite limited.
If the reporting site is generalizable, 1 in 14 residents would be actively infectious. Neighboring states are more like 1 in 20 to 1 in 60 actively infectious.
7/9
7/9 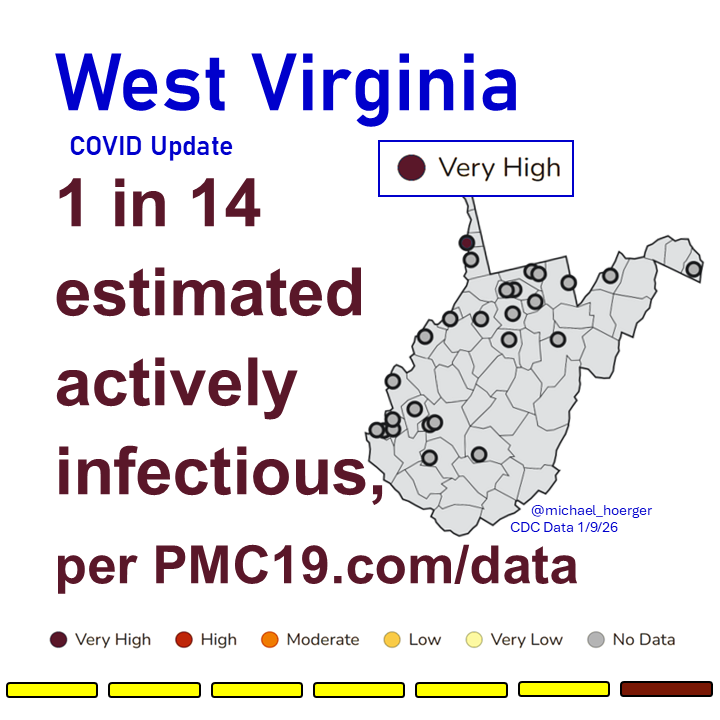
Transmission is also surging across the Northeast.
8/9
x.com/michael_hoerge
8/9
x.com/michael_hoergeMike Hoerger, PhD MSCR MBA@michael_hoerger
Jan 11
View on Twitter
BREAKING: COVlD Surge in the Northeast Intensifies
The CDC indicates 7 states have High or Very High levels. We use harmonized wastewater surveillance data to estimate the prevalence of how many people are actively infectious by state.
Let me highlight a few examples...
1/7
1/7 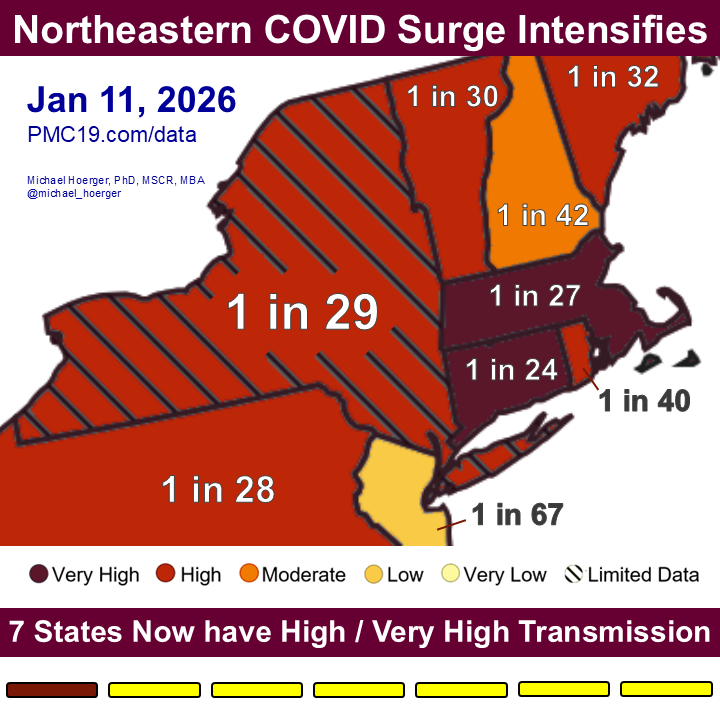
You can find more detailed data on our website (pmc19.com/data) and in the following thread. We update weekly, typically on Mondays.
9/9
x.com/michael_hoerge
9/9
x.com/michael_hoergeMike Hoerger, PhD MSCR MBA@michael_hoerger
Jan 10
View on Twitter
The size of the winter COVlD wave has been revised upward as post-holiday data come in.
We estimated 1 in 55 people in the U.S. are actively infectious.
 WV: 1 in 14
IN: 1 in 15
MI & OH: 1 in 21
MO: 1 in 22
CT: 1 in 24
KS: 1 in 25
MA & IL: 1 in 27
Quick 1/4
WV: 1 in 14
IN: 1 in 15
MI & OH: 1 in 21
MO: 1 in 22
CT: 1 in 24
KS: 1 in 25
MA & IL: 1 in 27
Quick 1/4
WV: 1 in 14
IN: 1 in 15
MI & OH: 1 in 21
MO: 1 in 22
CT: 1 in 24
KS: 1 in 25
MA & IL: 1 in 27
Quick 1/4 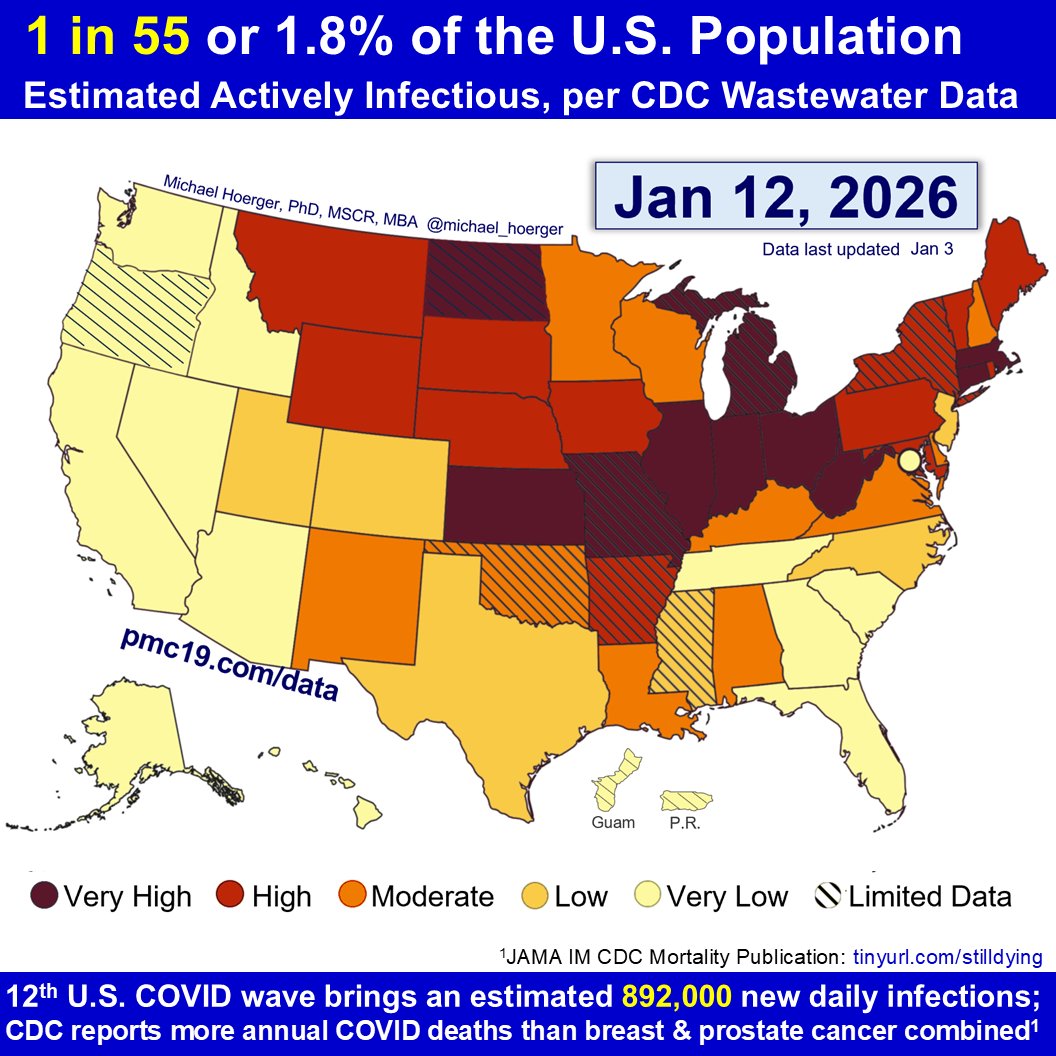

Mike Hoerger, PhD MSCR MBA
@michael_hoerger
Expert in weighing medical evidence, cancer, COVID forecasting & mitigation, health disparities, financial analytics. 120 publications. PhD program director.
Missing some tweets in this thread? Or failed to load images or videos? You can try to .